Gallery
Data visualizations from research and consulting work — seaweed optics, connectomics, plant photosynthesis modeling, aerospace, and more.
 6
6 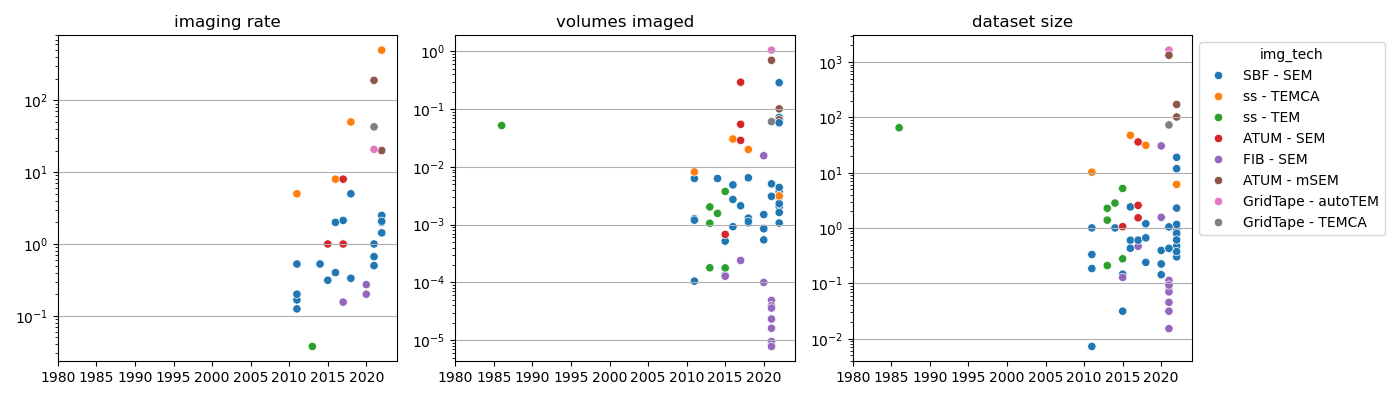 Imaging Speed
 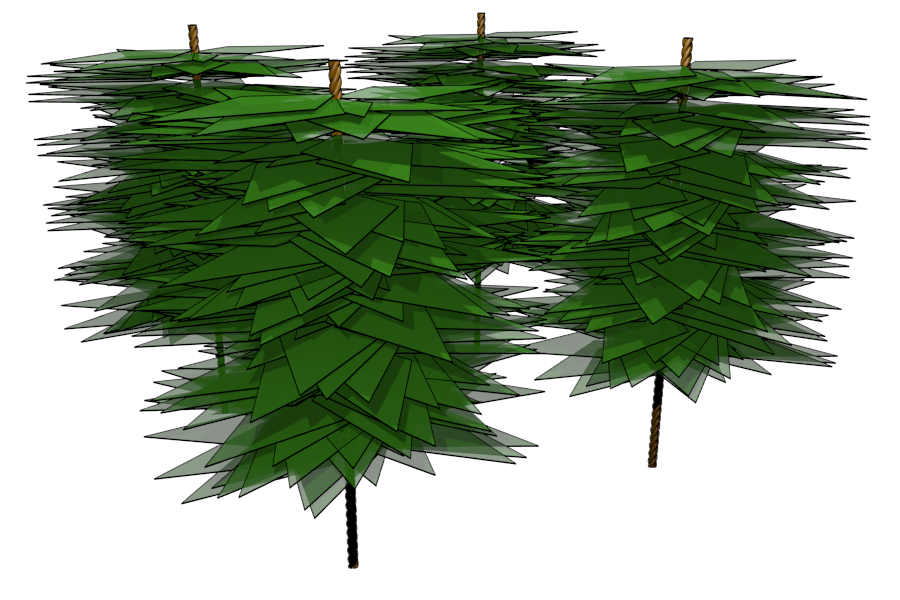 Kelp Array
 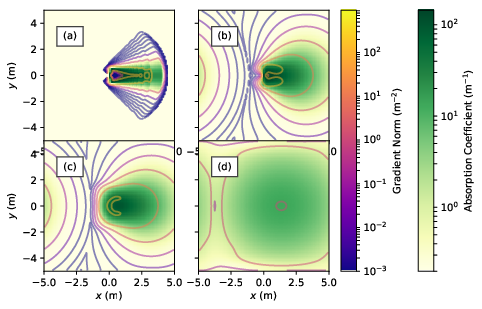 Abs Coefs Combined
 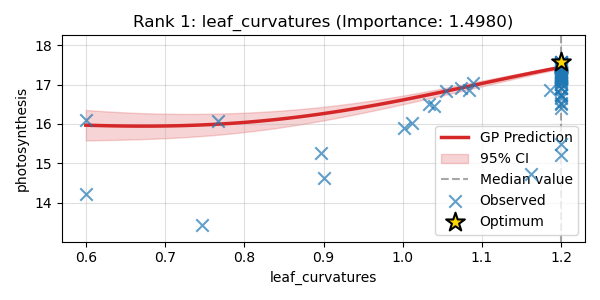 Plant Fixed Leaf Size Univariate 1
 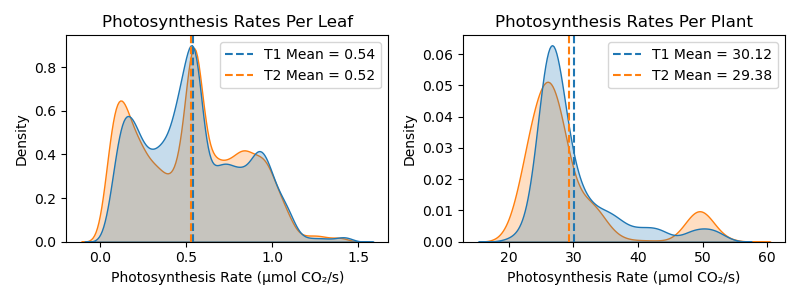 Photosynthesis Distributions
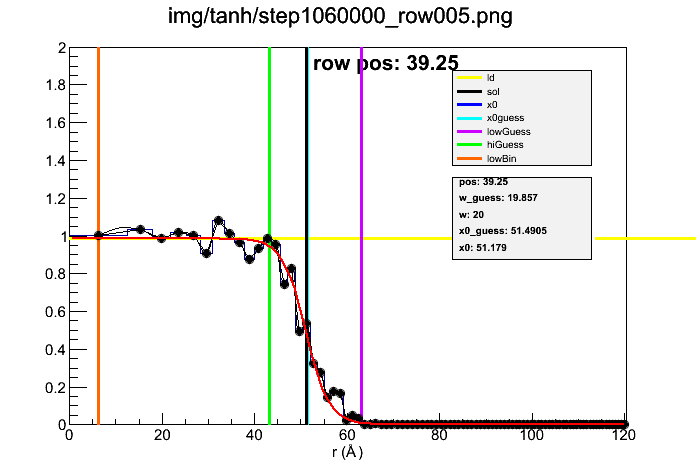
 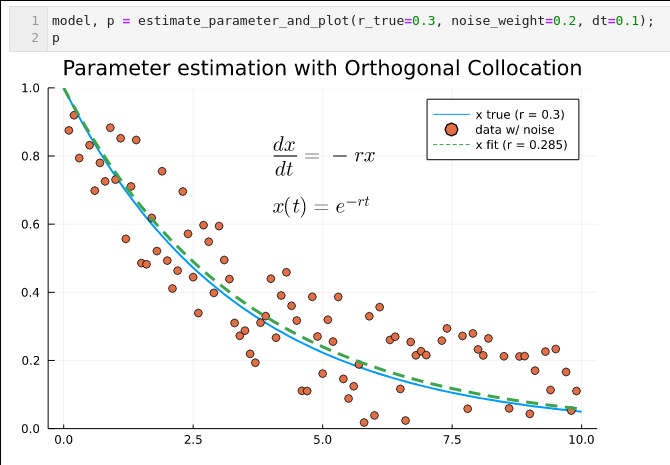 Parameter Estimation Example
 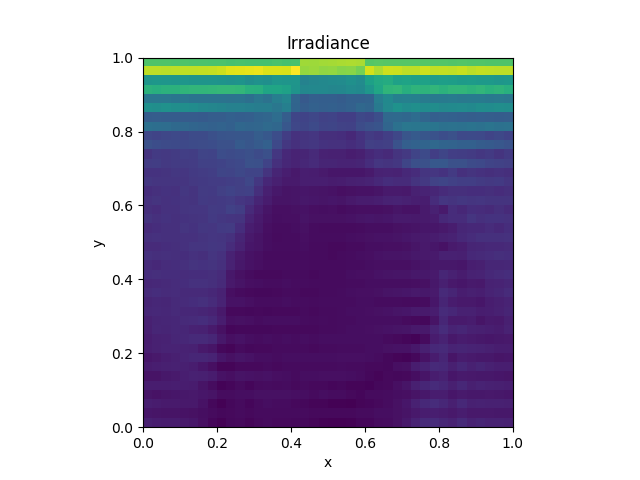 Conv 40x10
  Int Hq 6x6x6 102
  Min N Data Vs Ab
  Spatialgrid
  Angular Grid Plots
 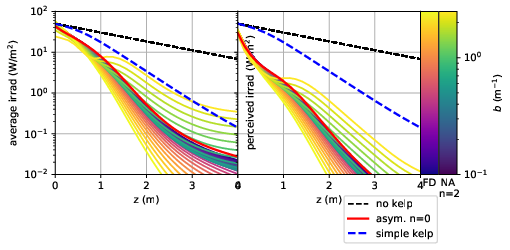 Compare Models N2 Zoom
 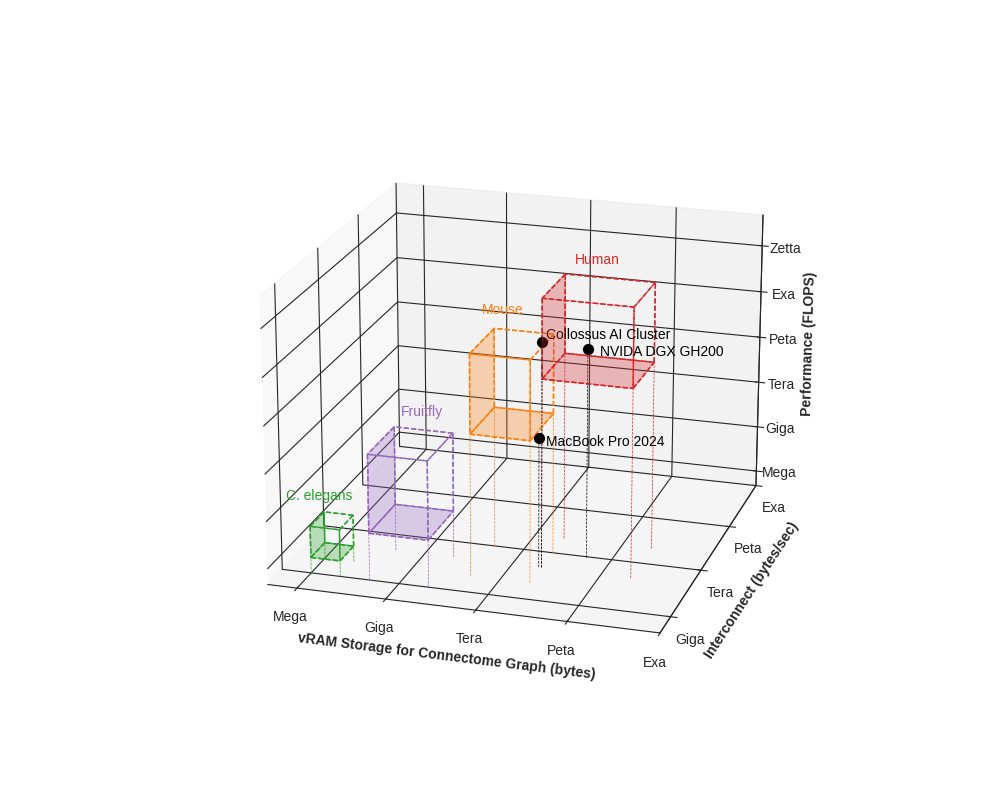 Organism Compute
 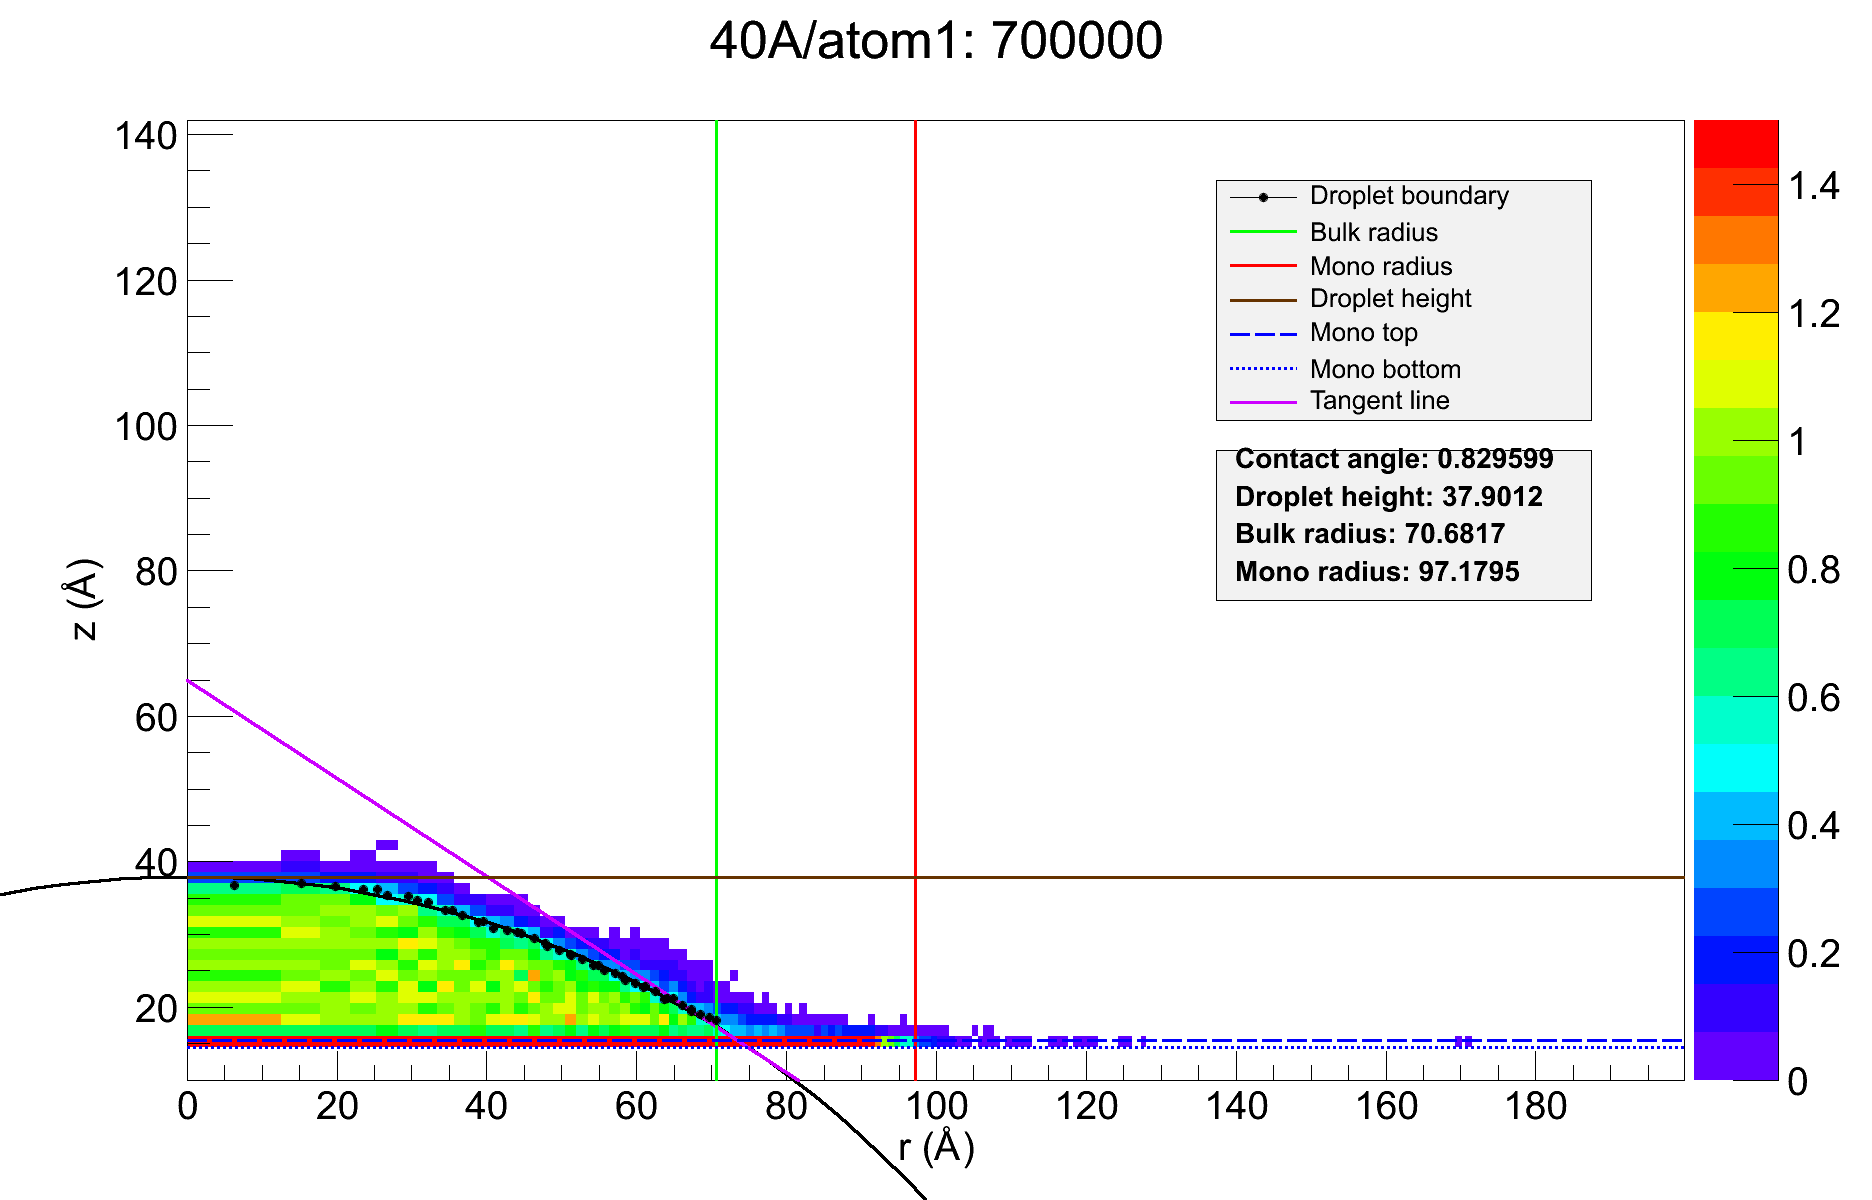 3
3 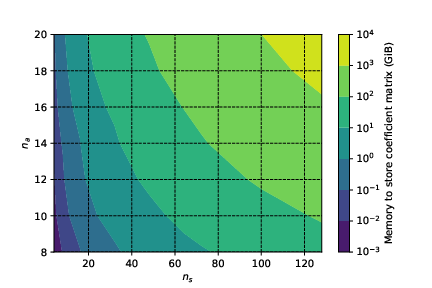 Memory Store
 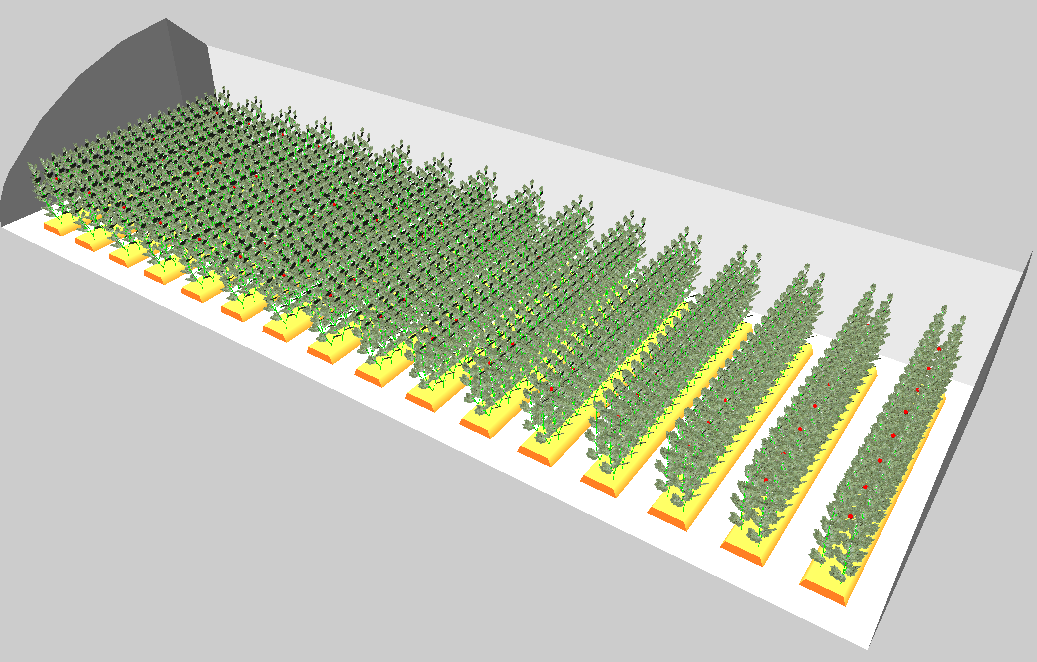 T1 Optimal
 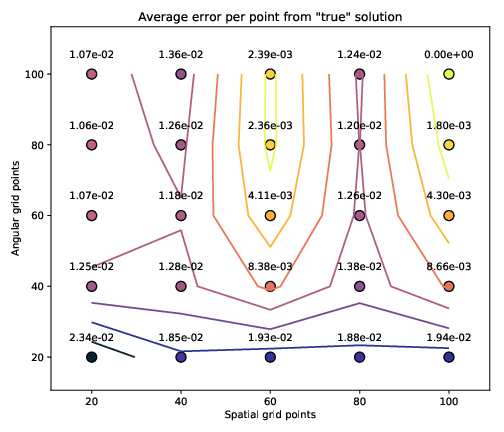 Avgerr
 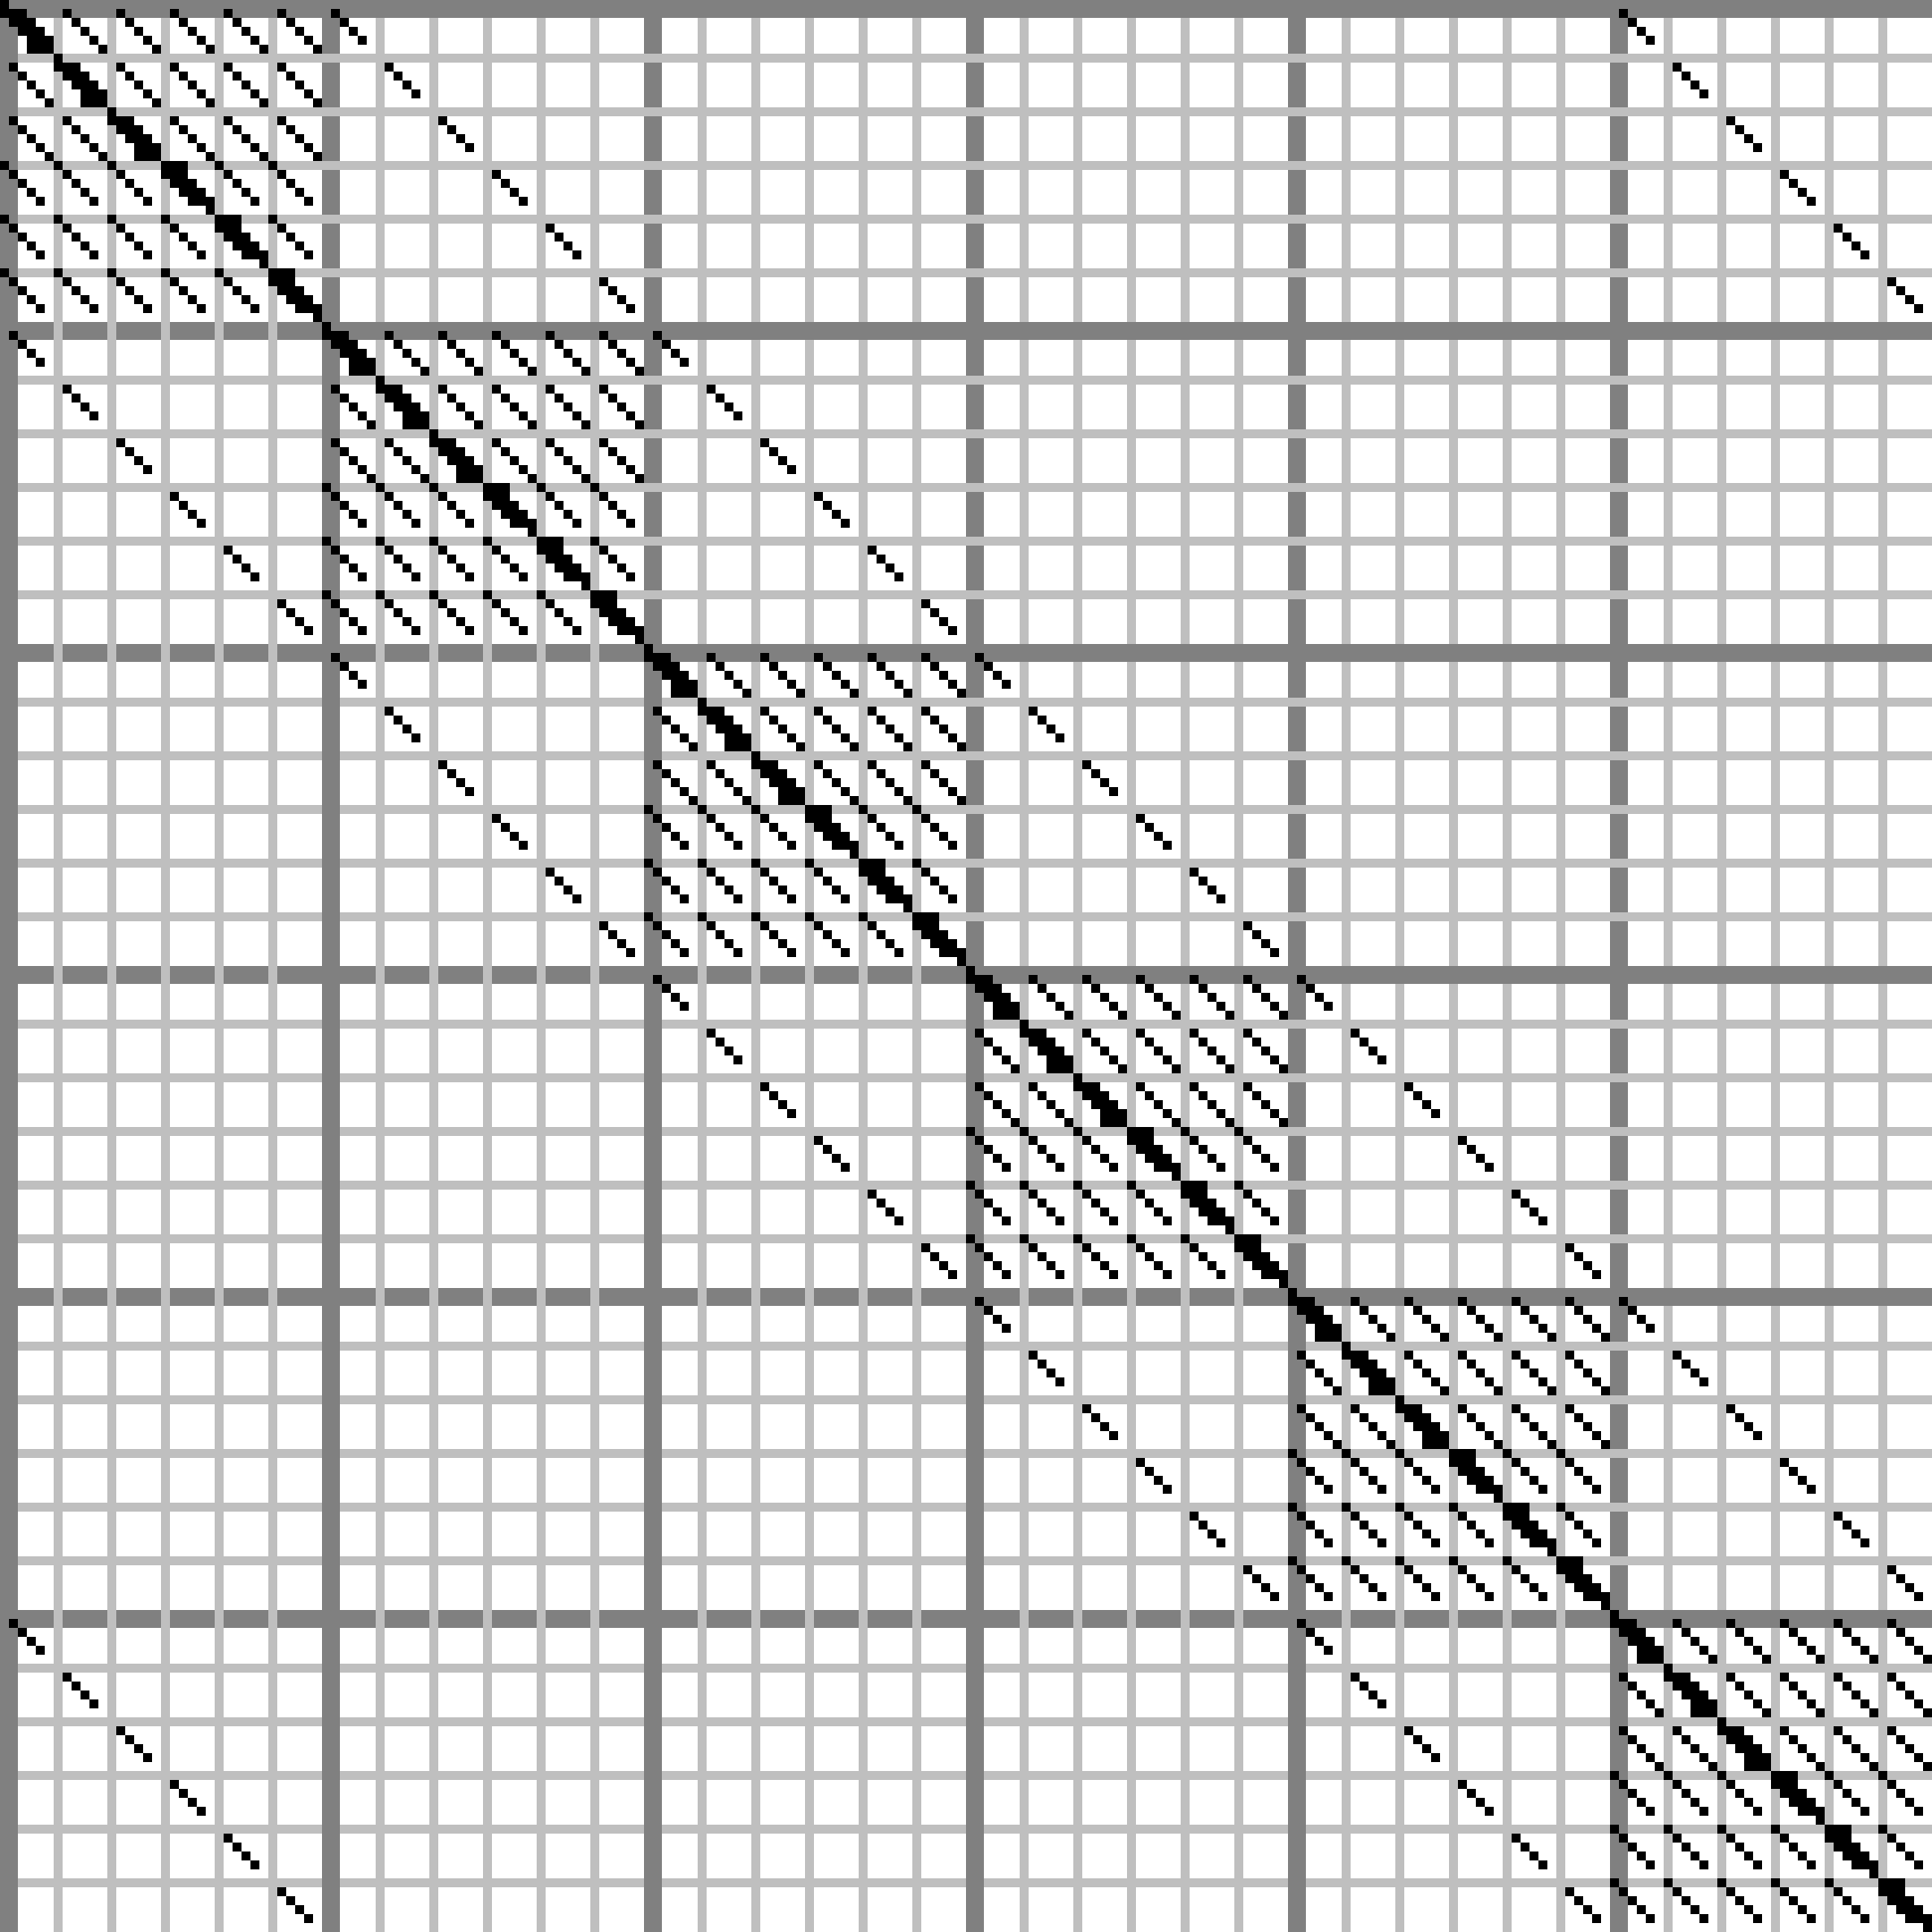 Int Hq 6x6x6 021
 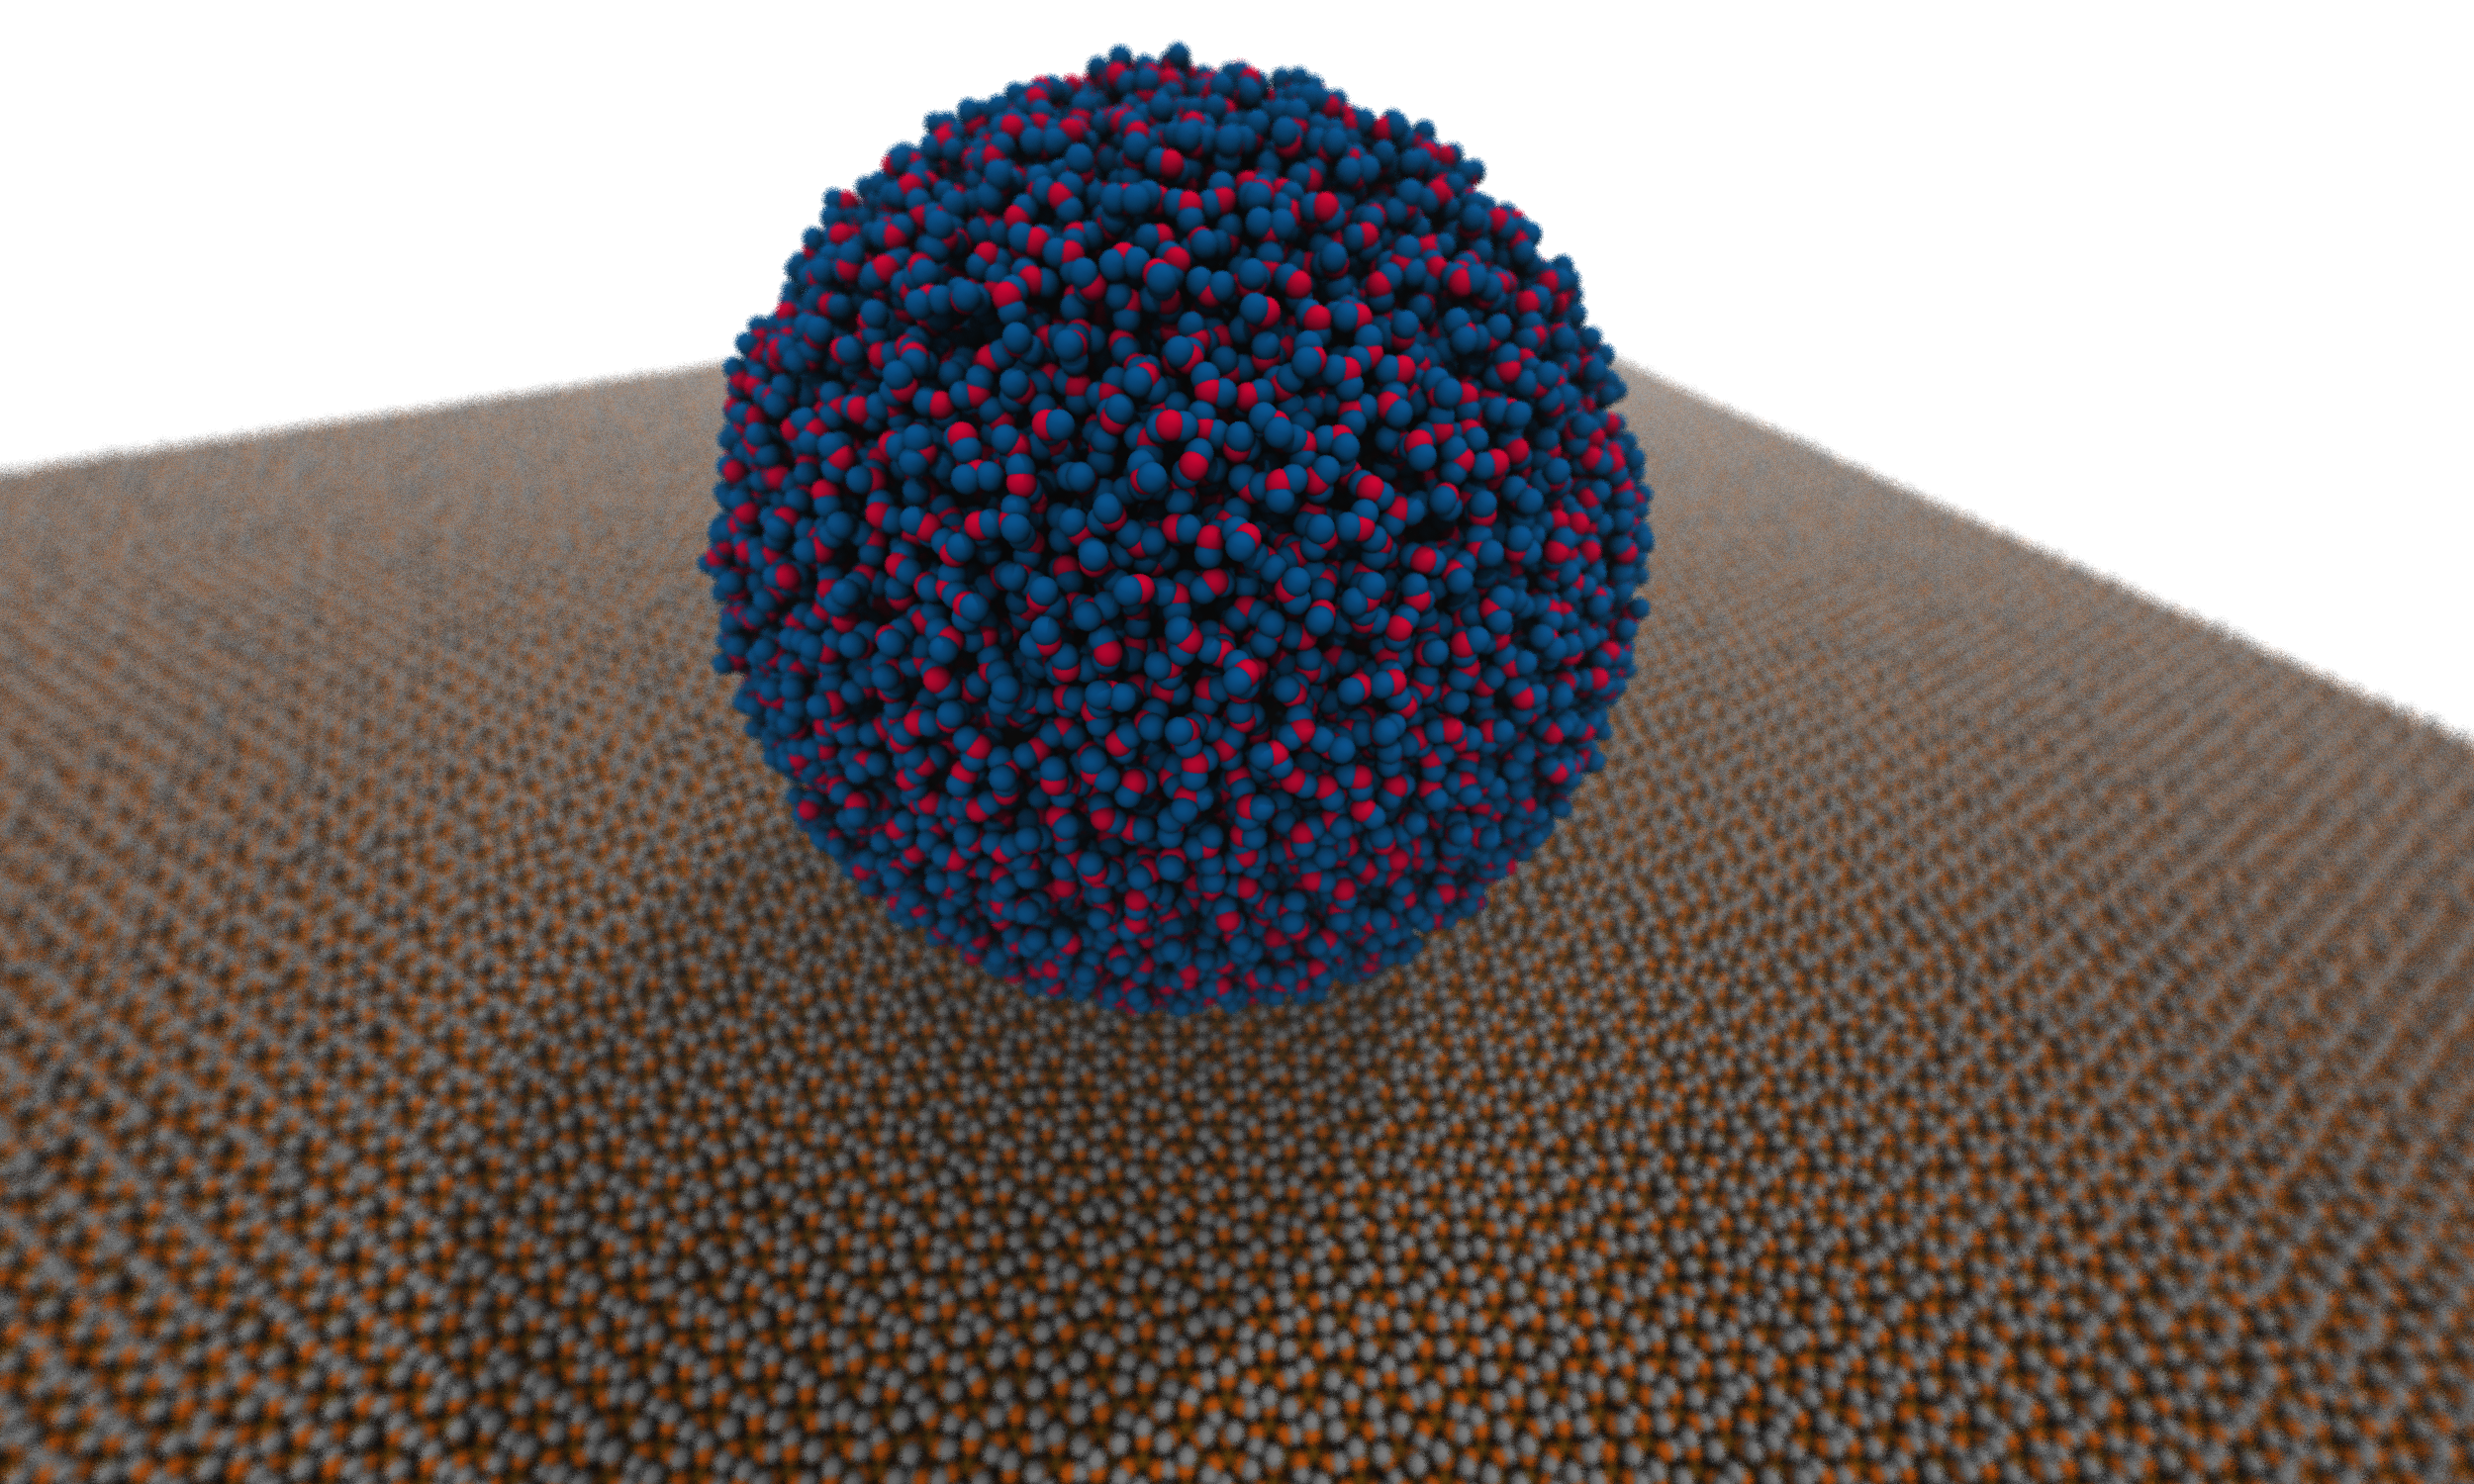 Image Original
 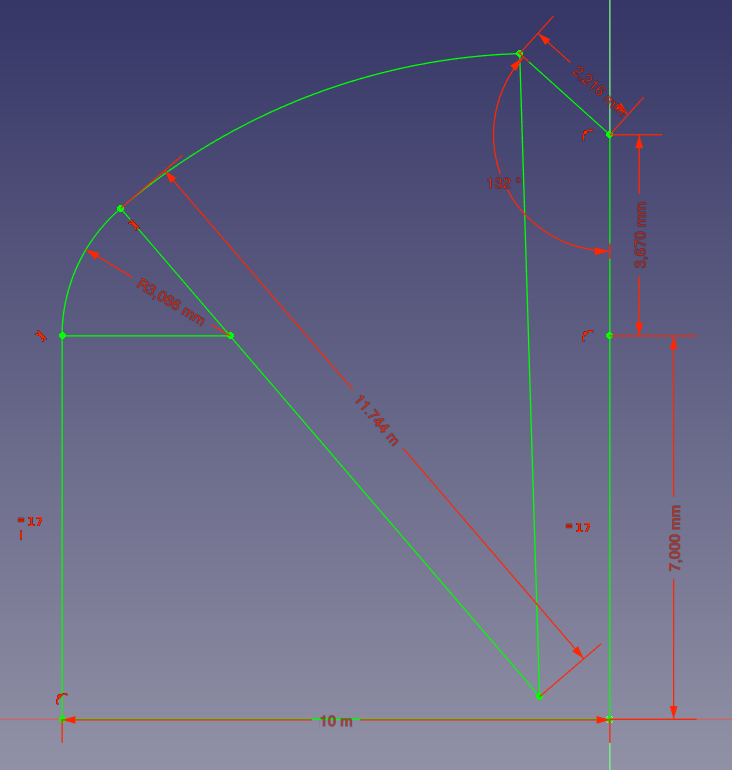 Greenhouse Cad
 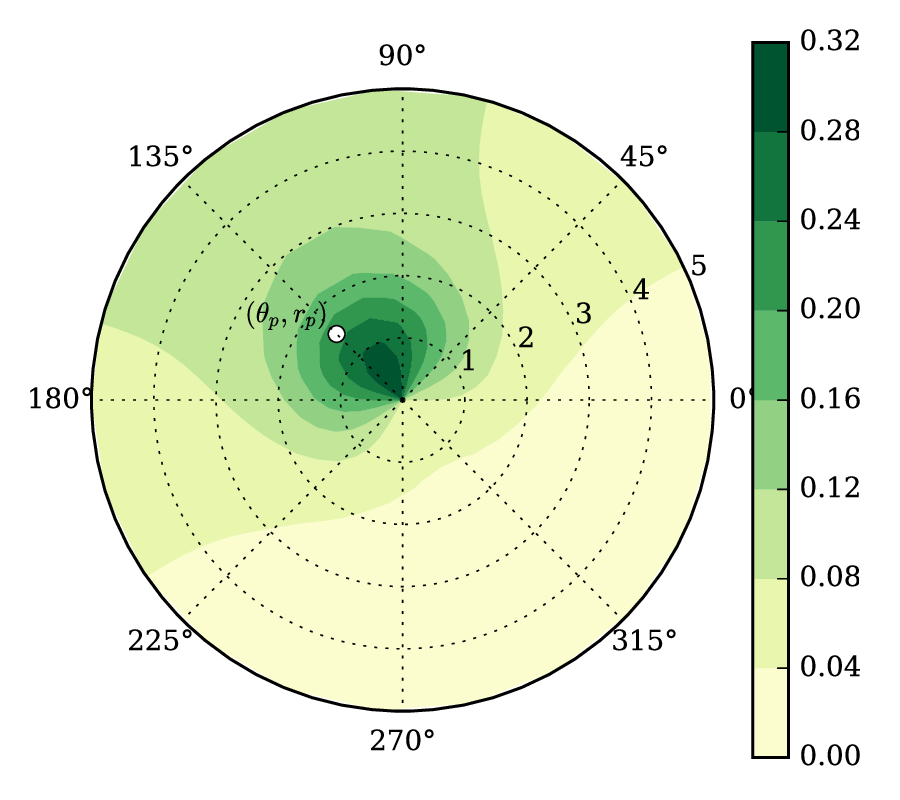 Prob Shade
 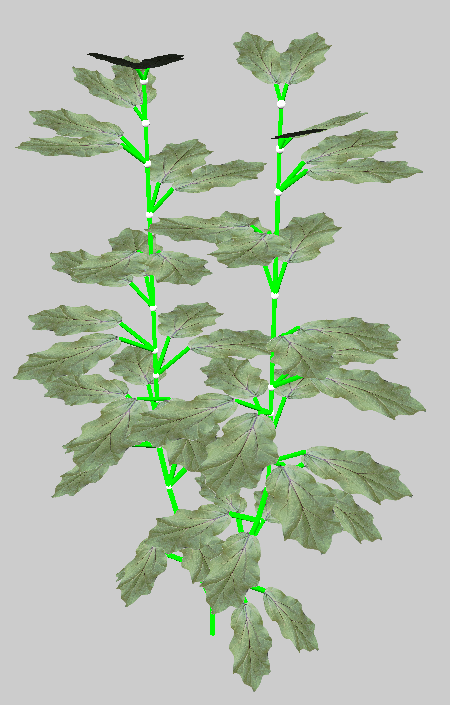 Single Baseline
 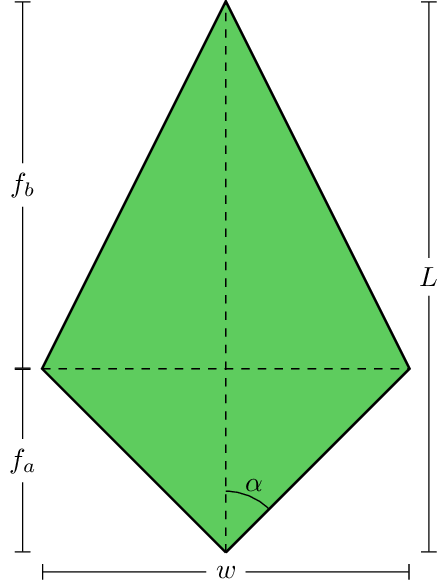 Frond
Frond 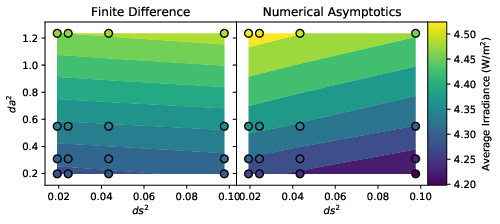 Gs Avg Irrad Contourf
 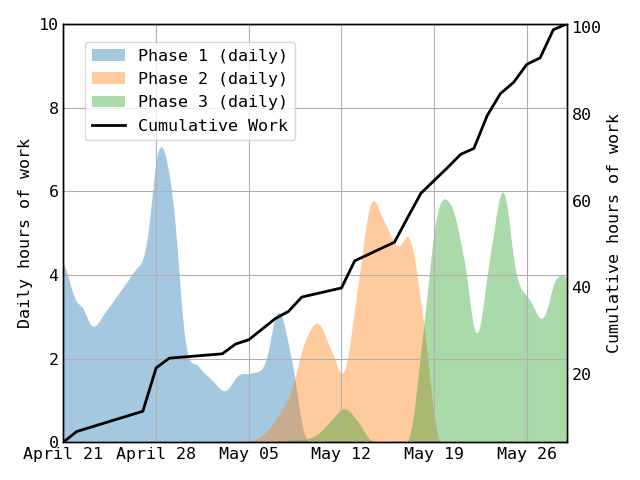 Groimp Line
 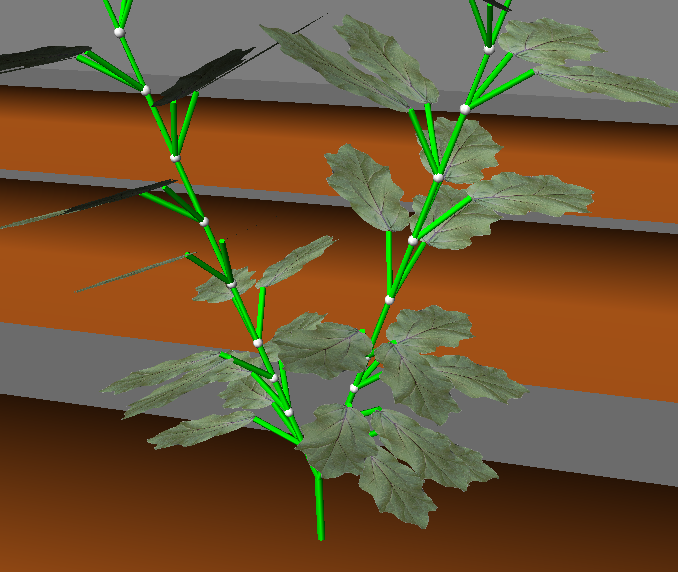 2025 04 29 024620 678x572 Scrot
 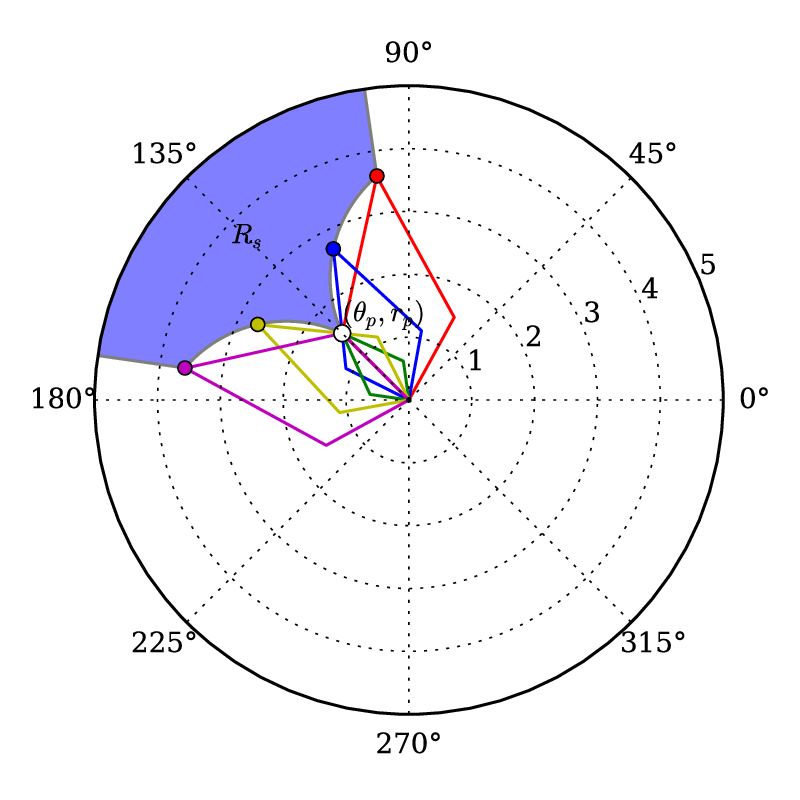 Shade Area
 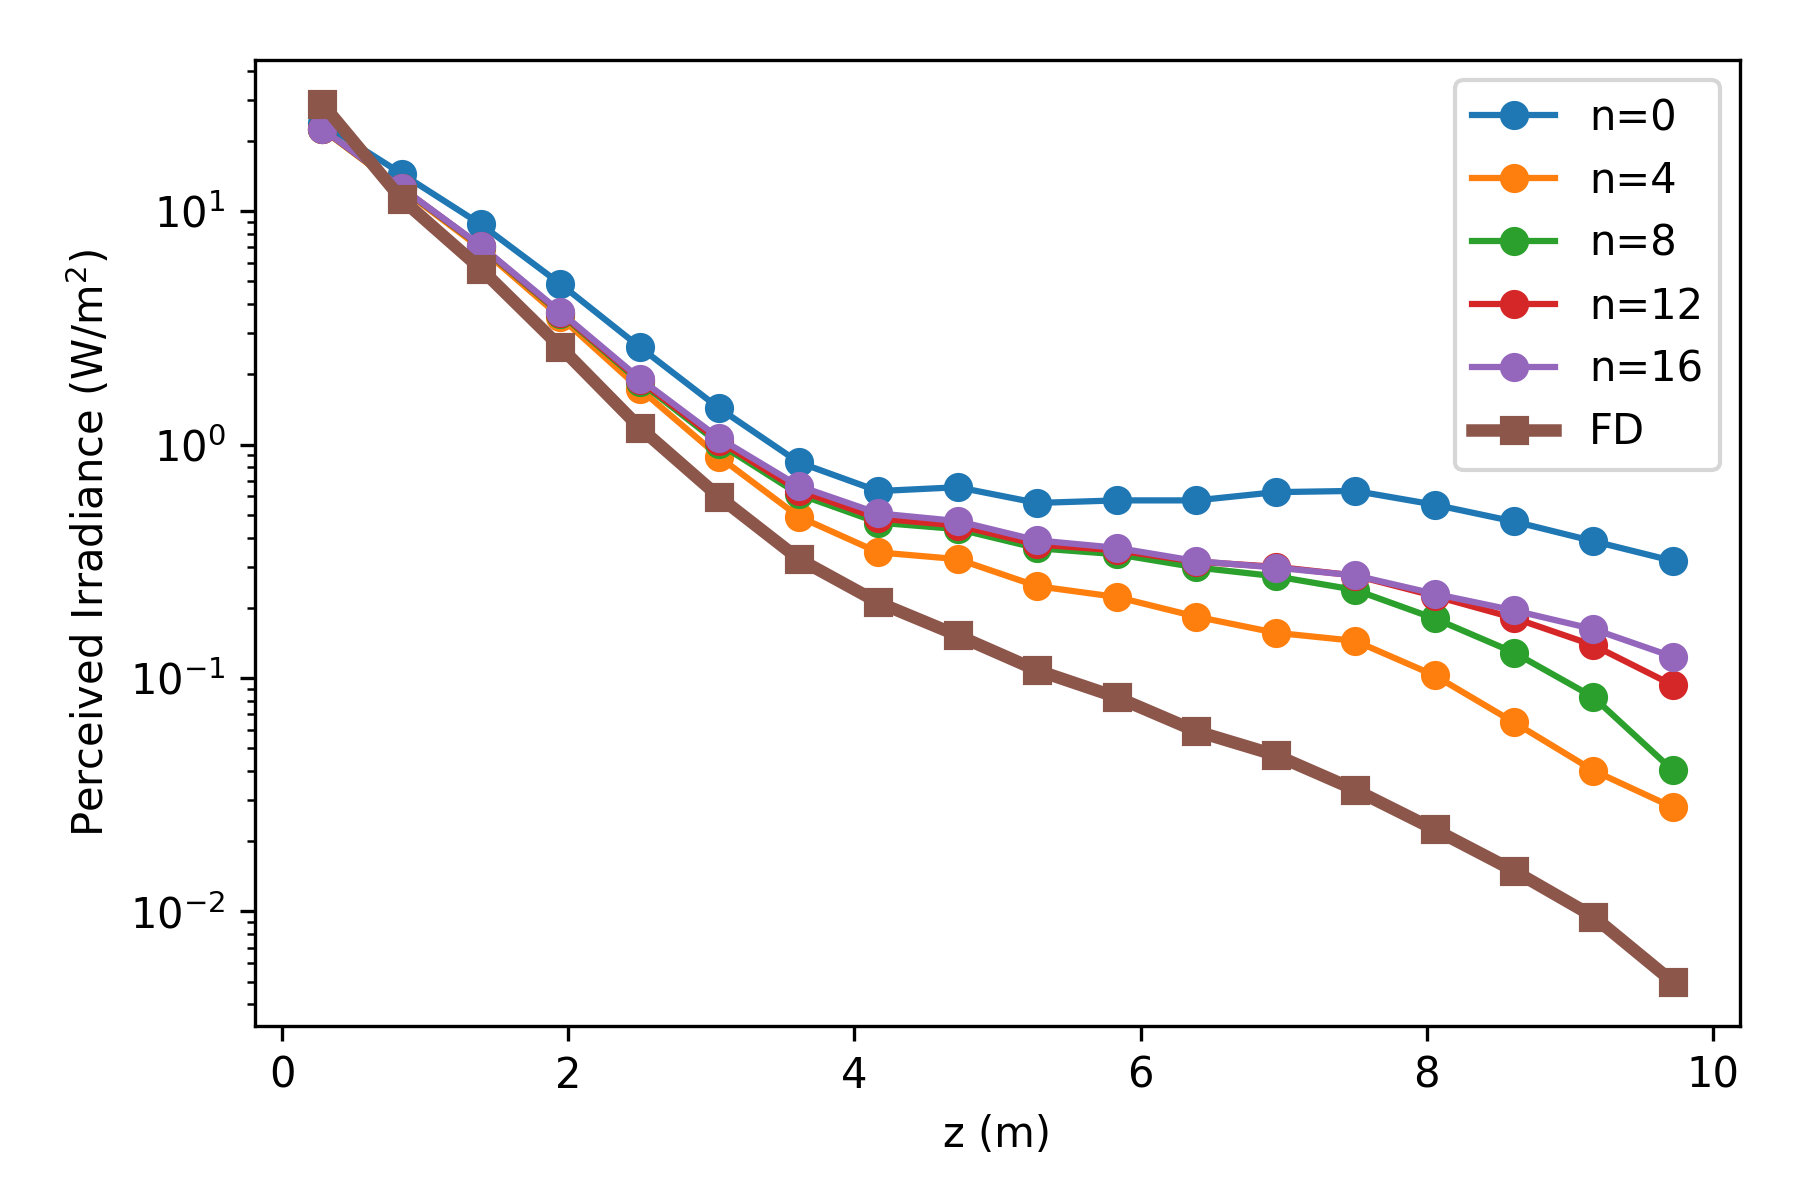 Asym Conv Irrad Hao11
 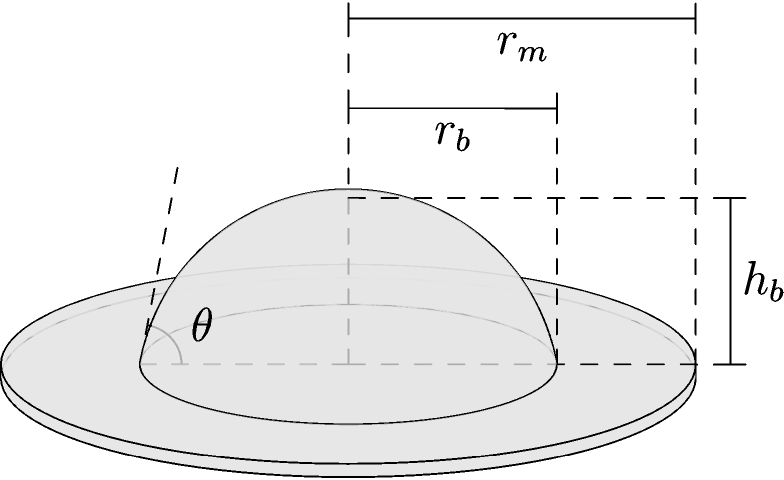 Droplet Quantities
 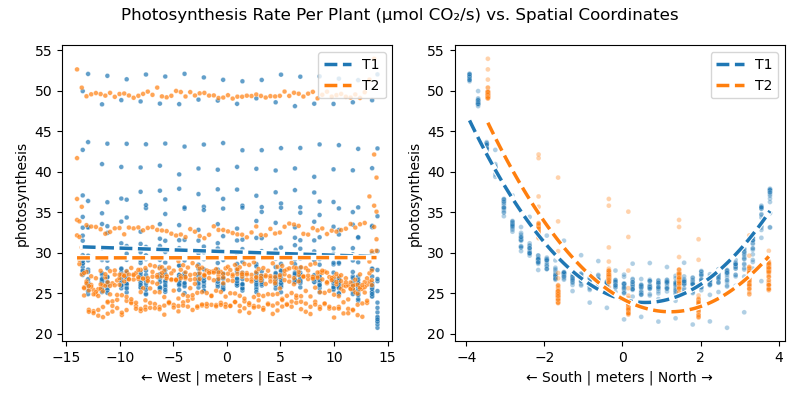 Plant Photosynthesis Fit
 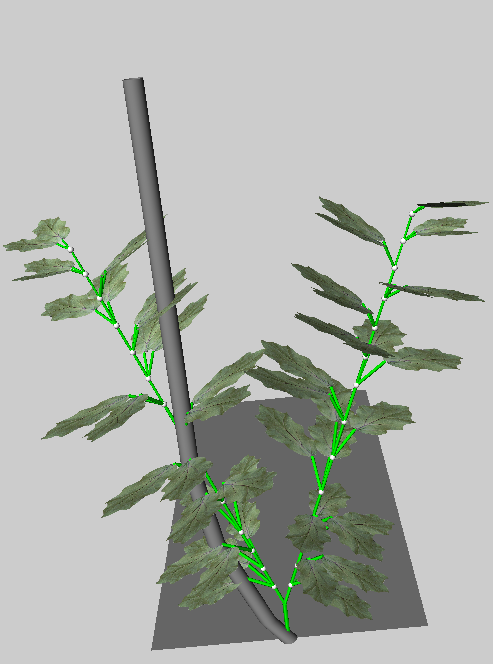 2025 05 07 013943 493x664 Scrot
 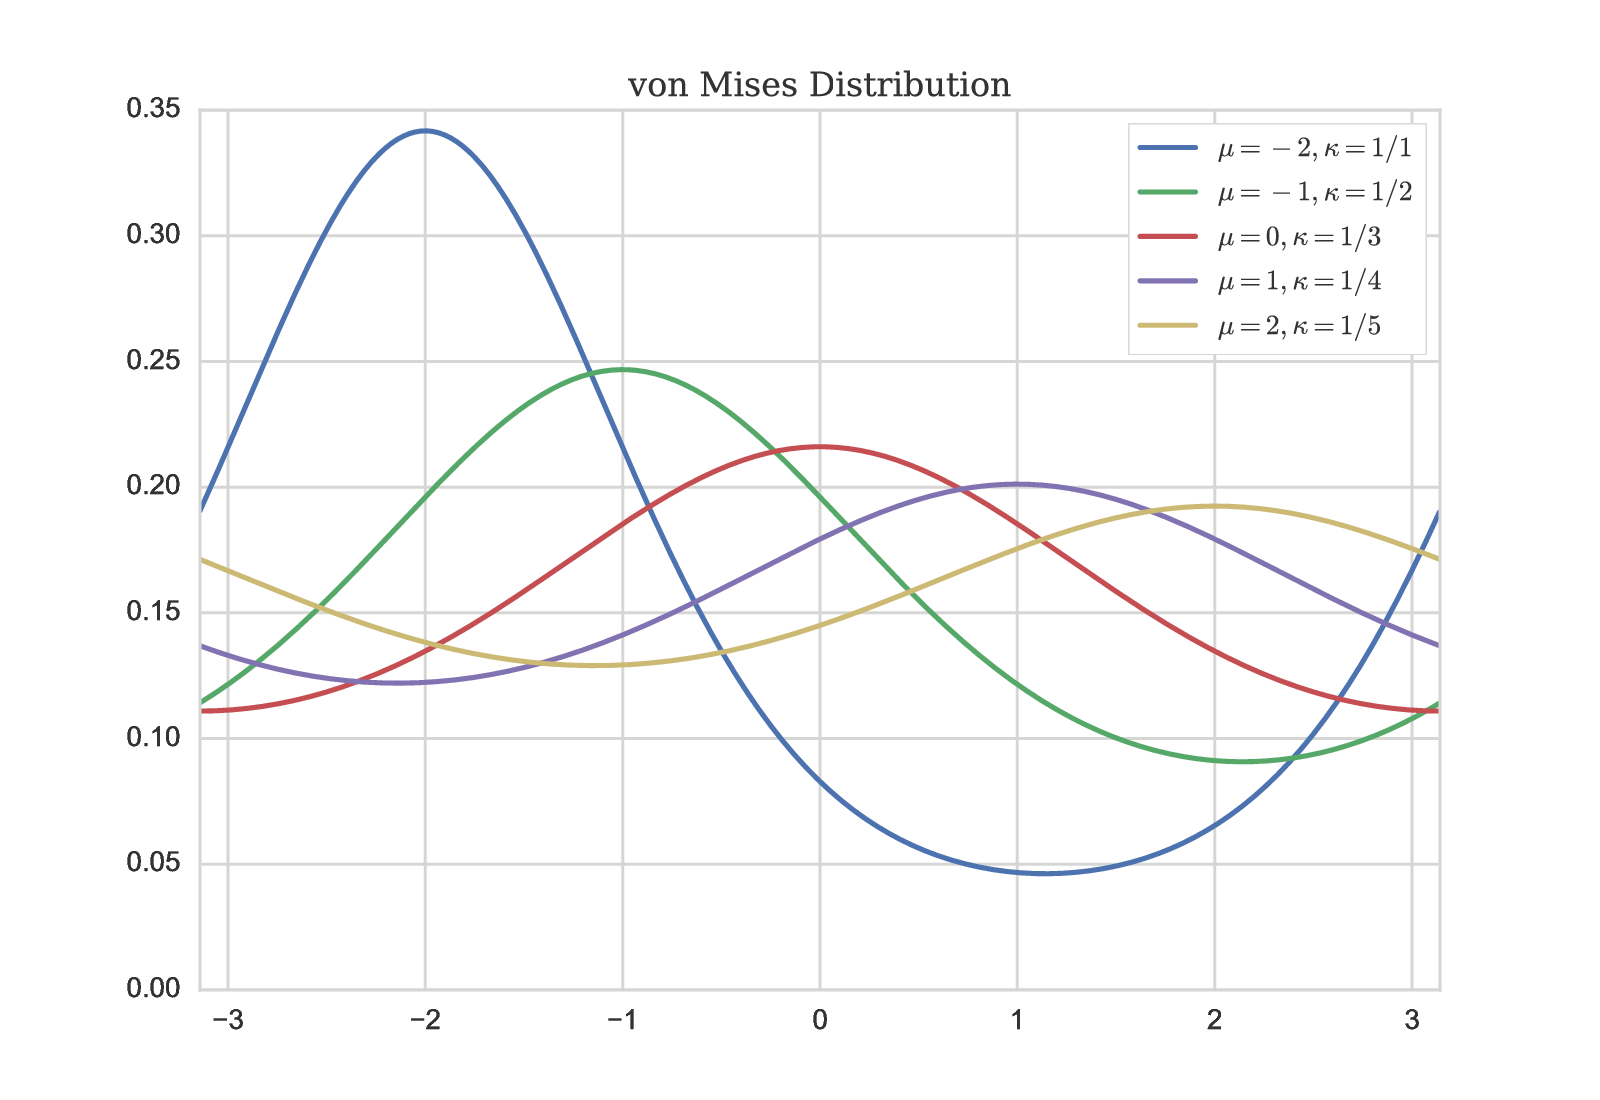 Vonmises
  HP20
HP20 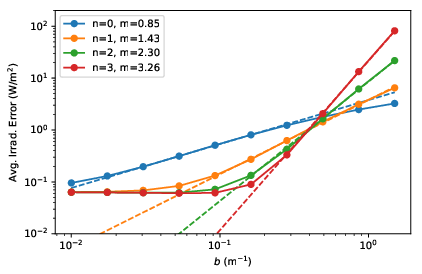 Asym Err Vs B A01
 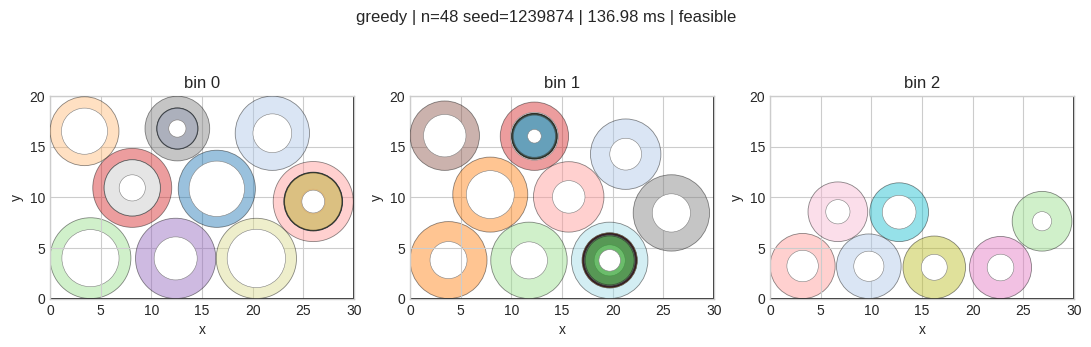 Output
 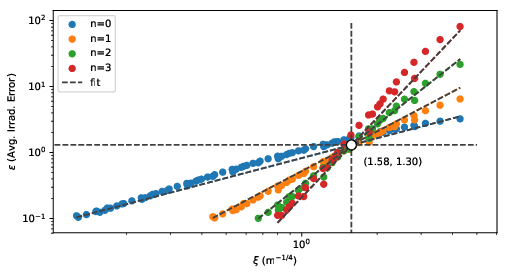 Asym Err Vs Xi All N Fit All
 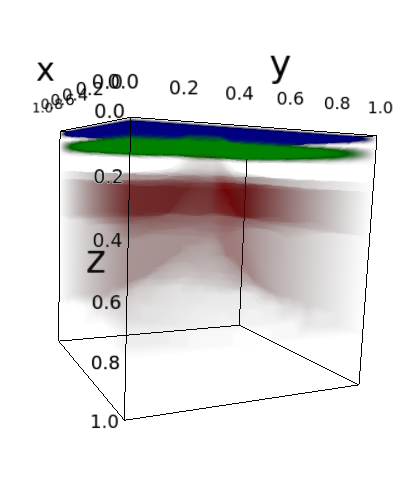 Bottom Heavy Irrad
  Int Hq 6x6x6 210
 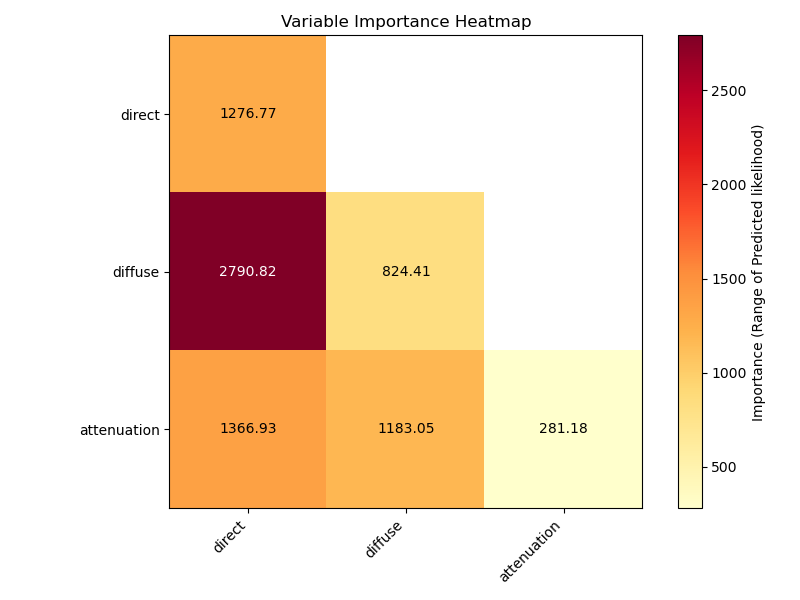 Lighting Calibration Heatmap
  Model Diagram Crop
  Asym Err Data Xi Model
  Final Rects 9.5 Hr
  Lighting Calibration Bivariate 1
  0892
0892 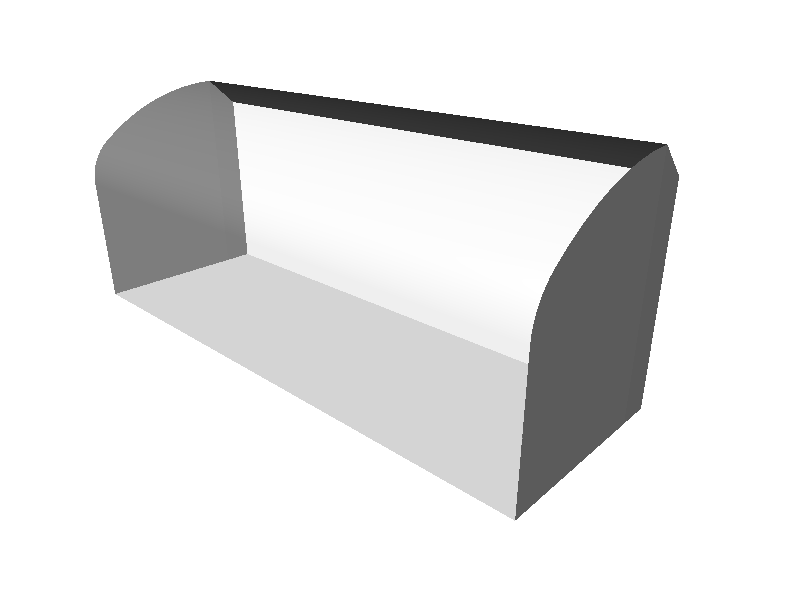 Greenhouse Rendered
 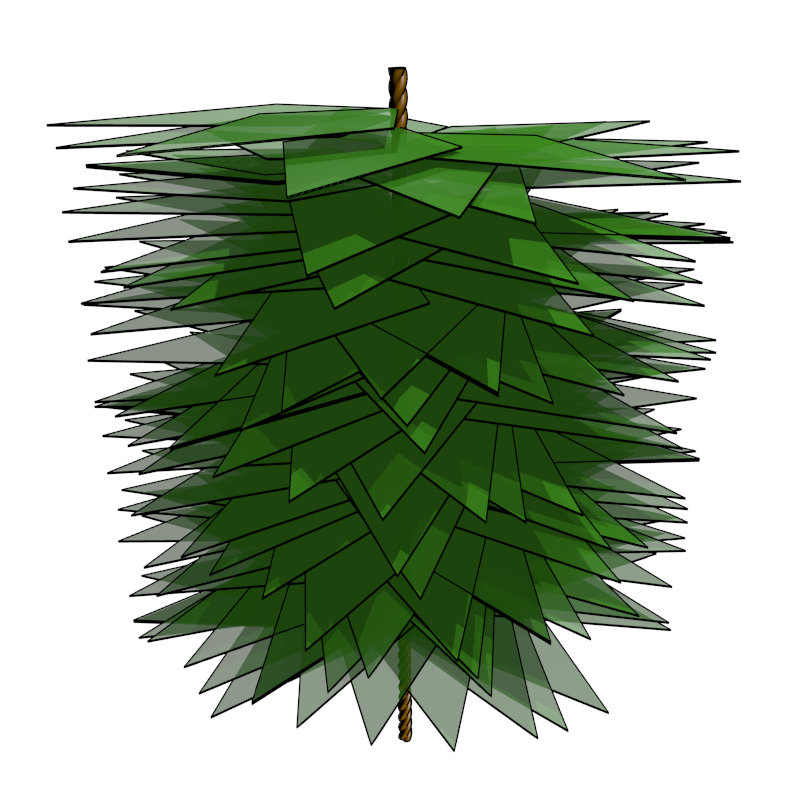 Kelp
Kelp 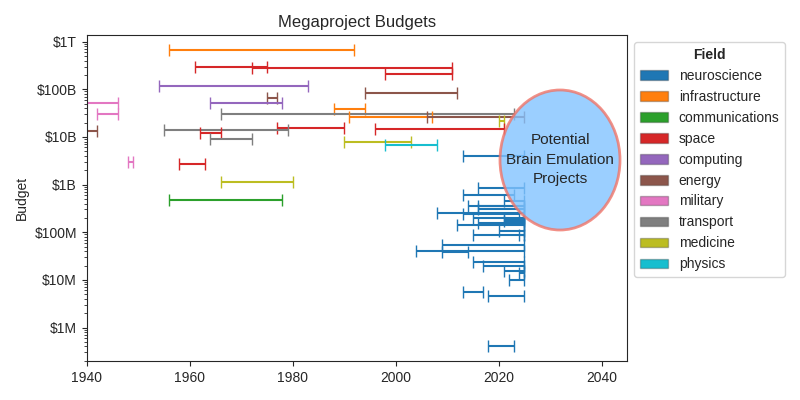 Funding
 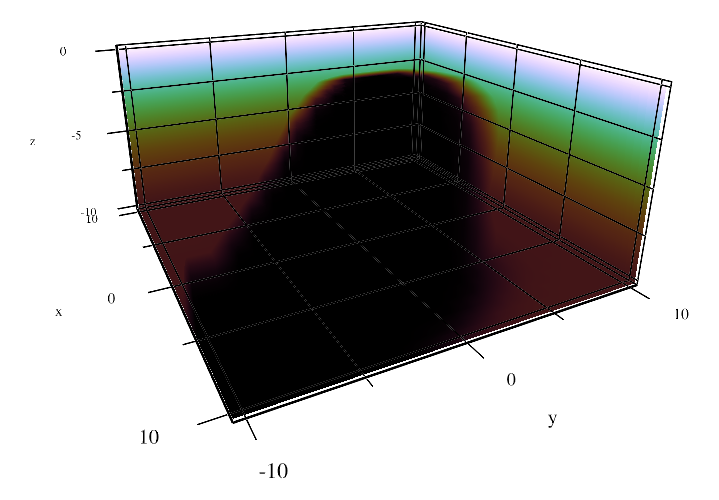 Simple3d
 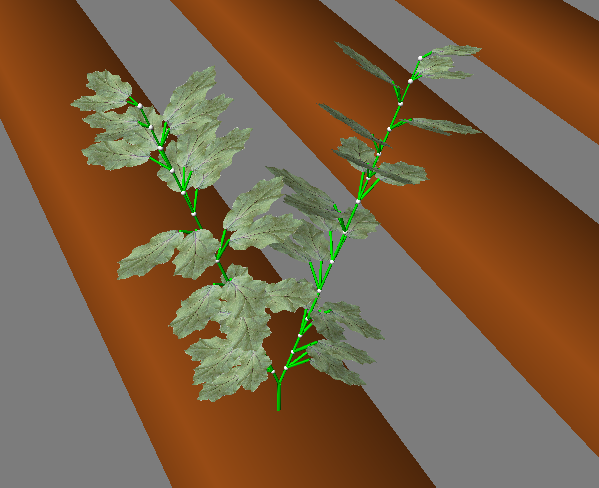 2025 04 29 024459 599x488 Scrot
 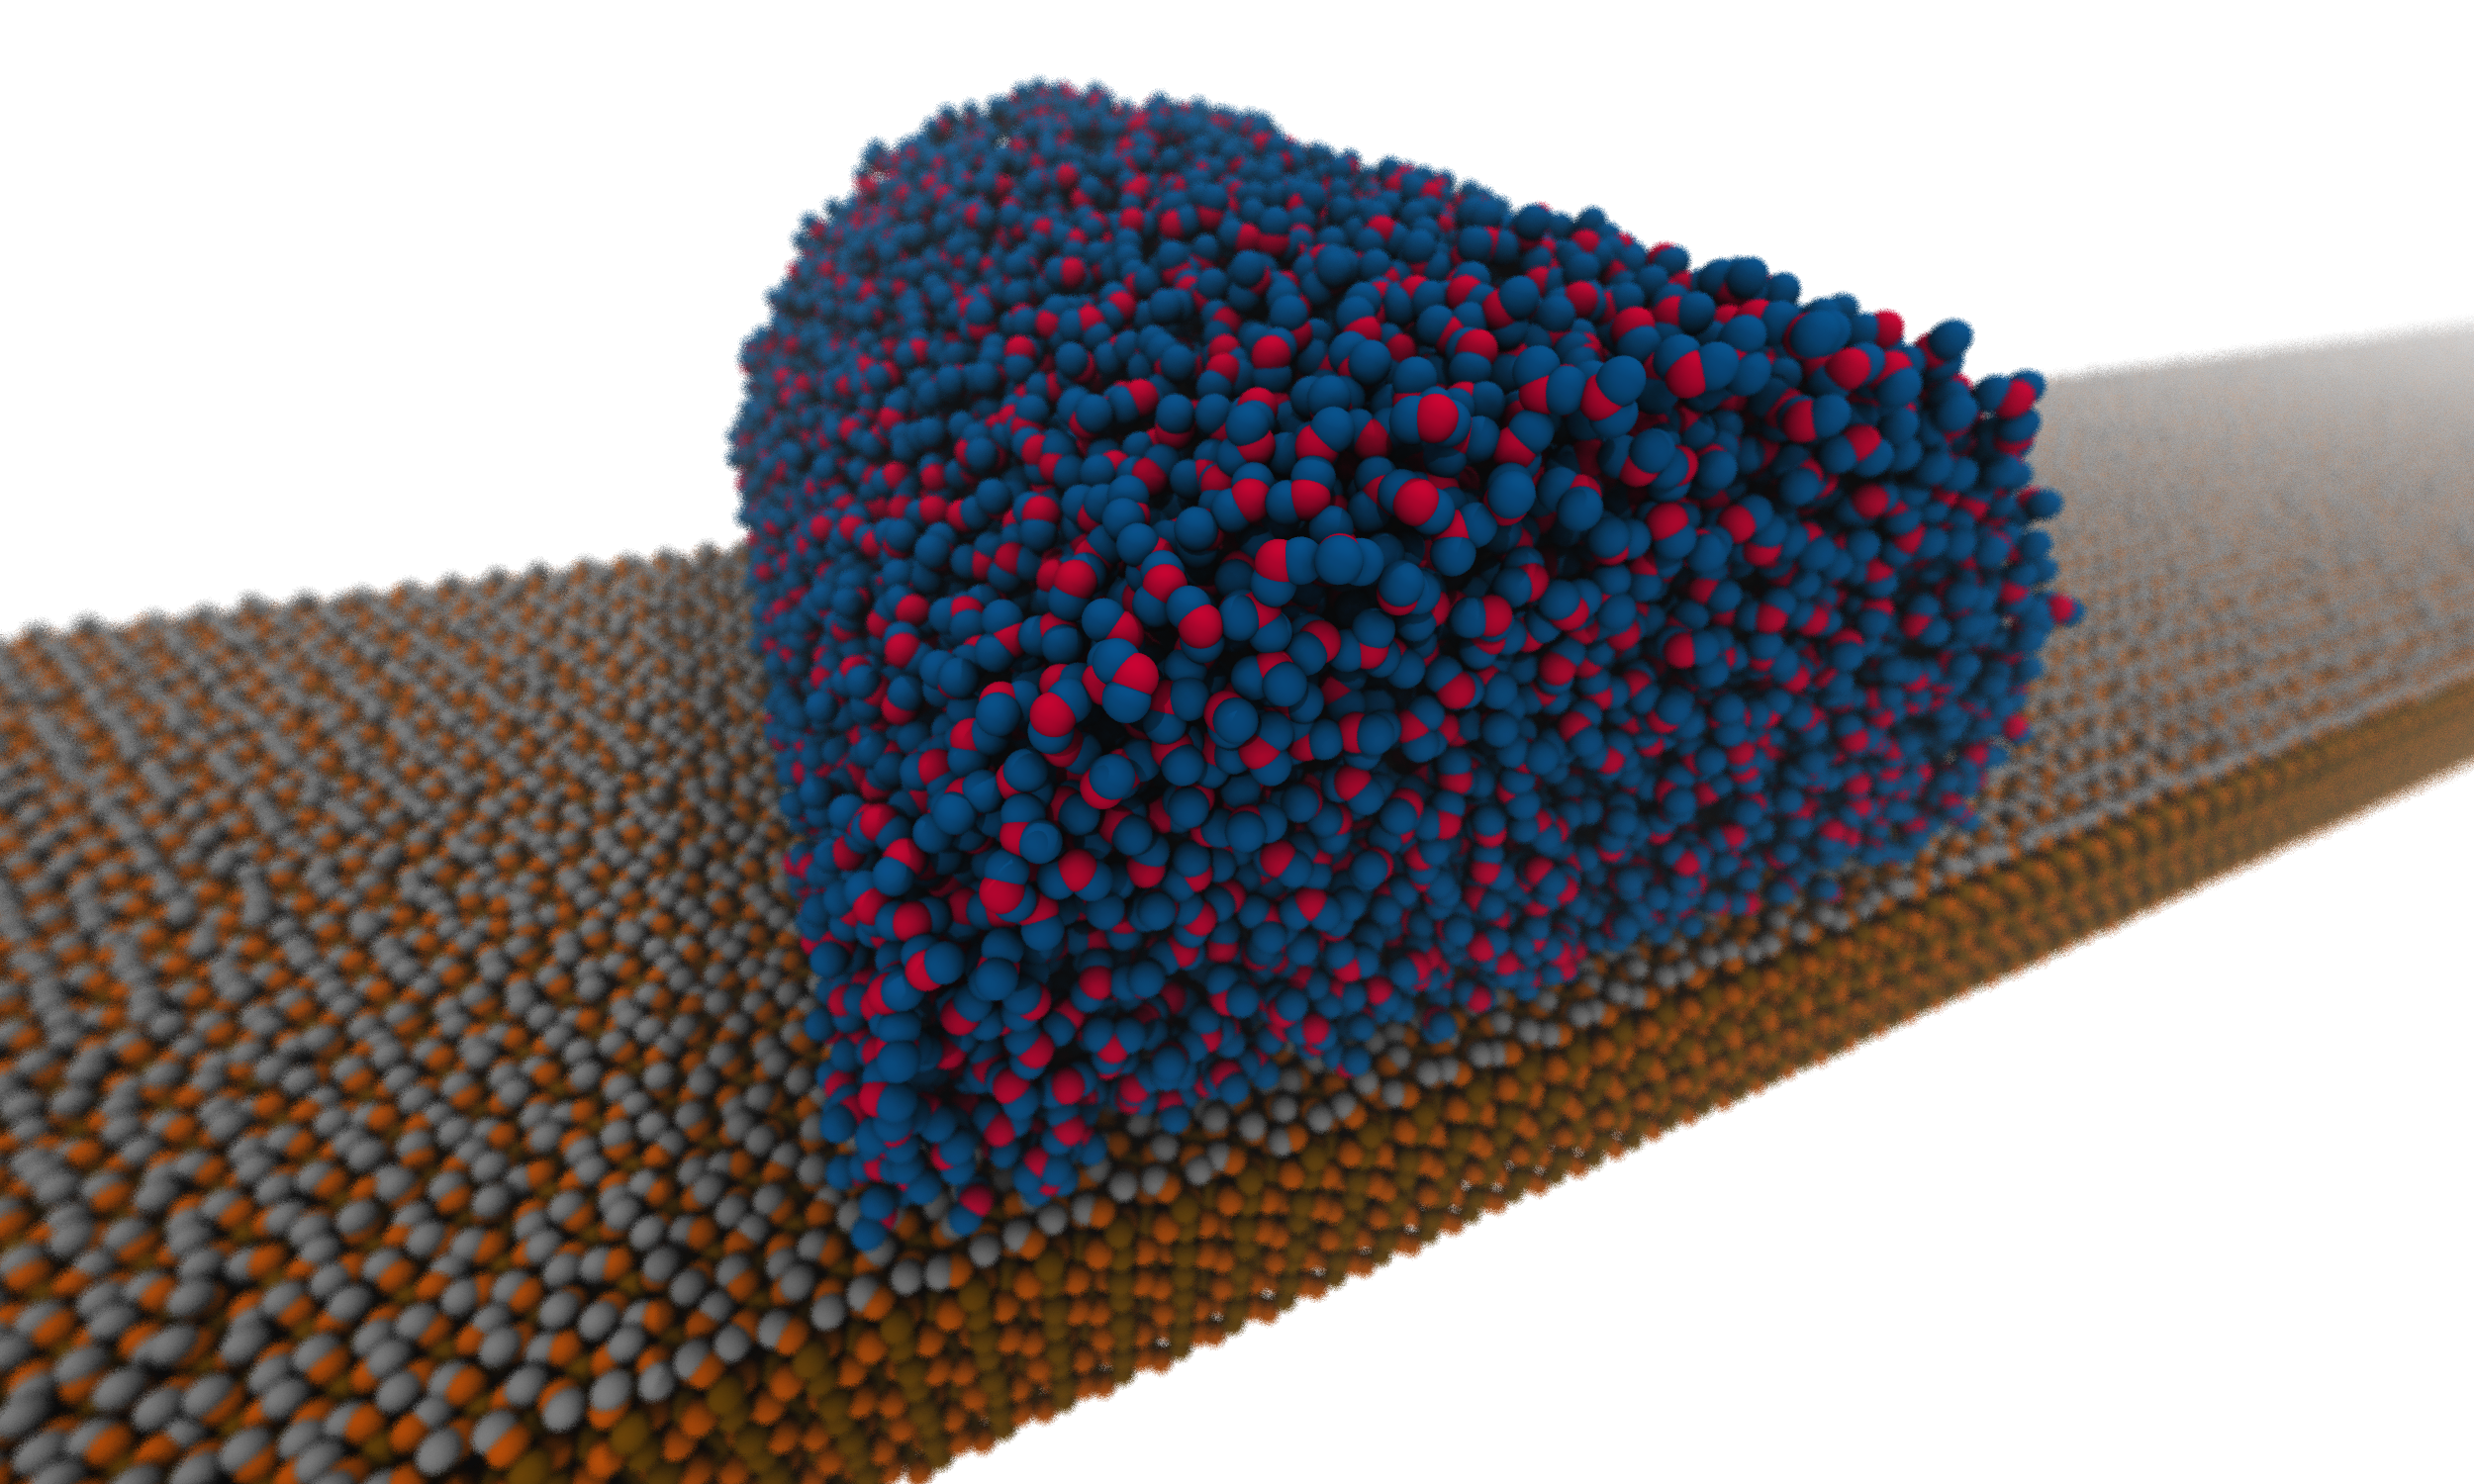 Image Original1
 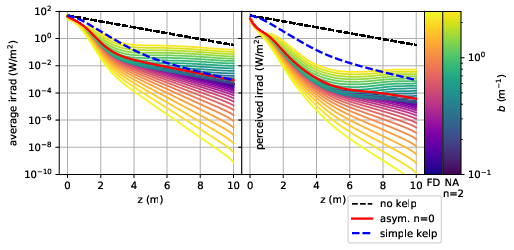 Compare Models N2
 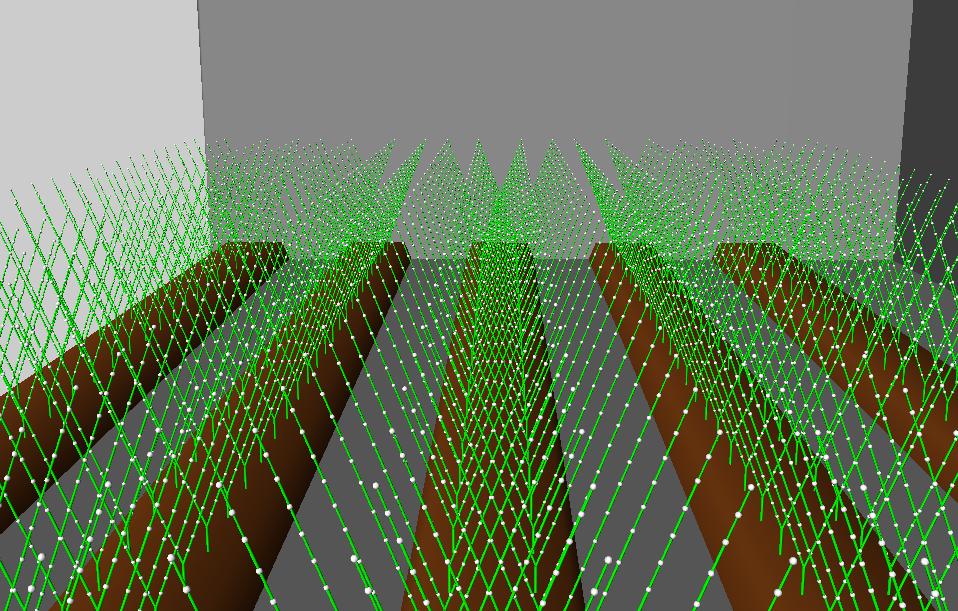 2025 04 29 031921 958x611 Scrot
  2025 05 07 115356 273x645 Scrot
  Image Original2
  Angulargrid
  Neuro Recordings
 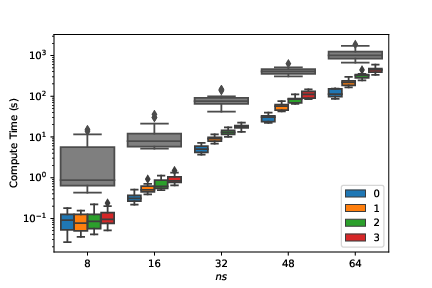 12
12 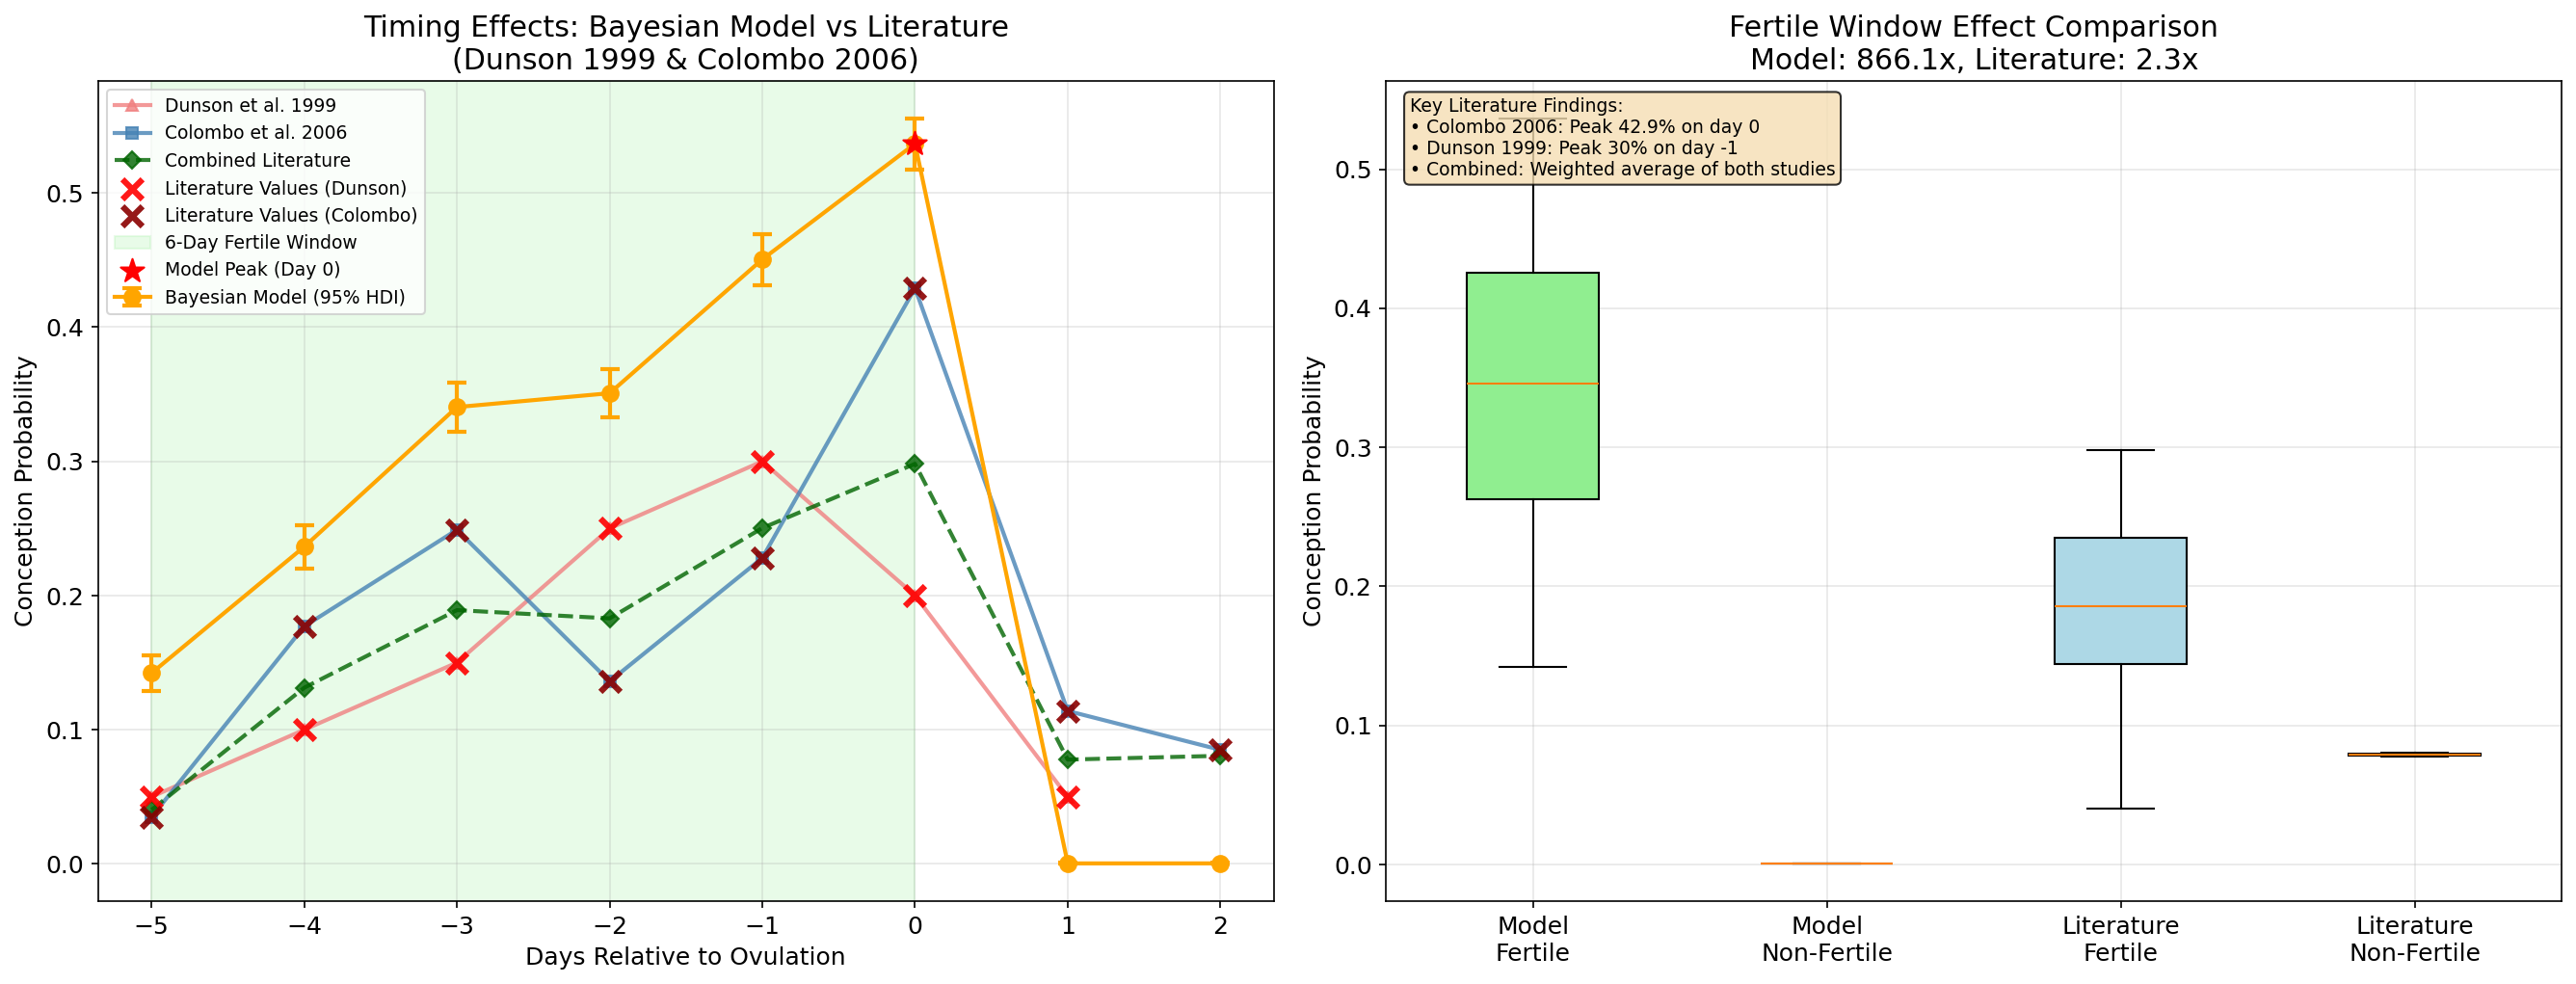 Timing Effects Bayesian Validation
 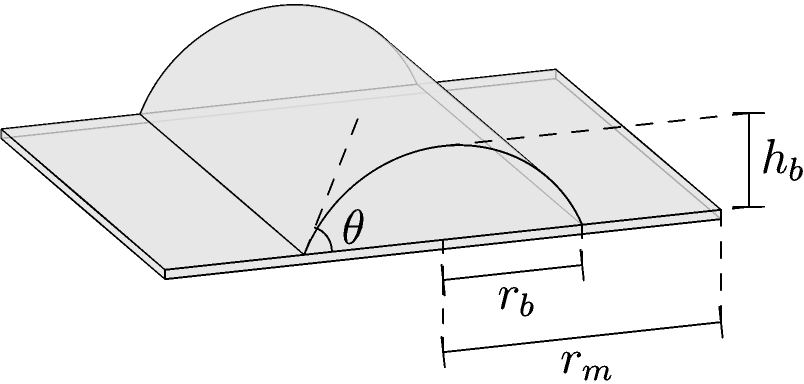 5
5 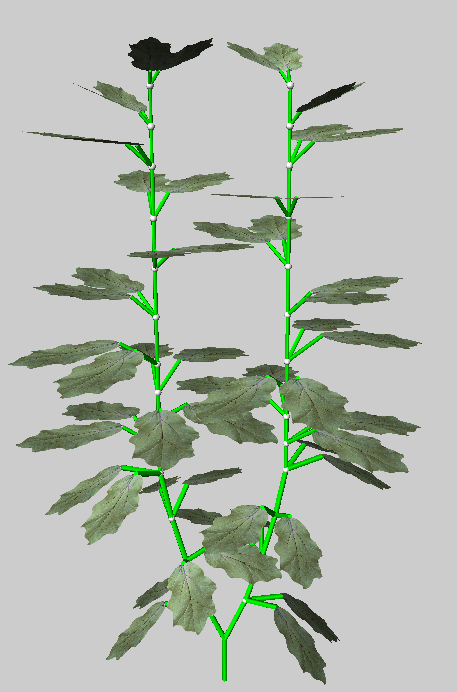 2025 05 07 115348 457x692 Scrot
 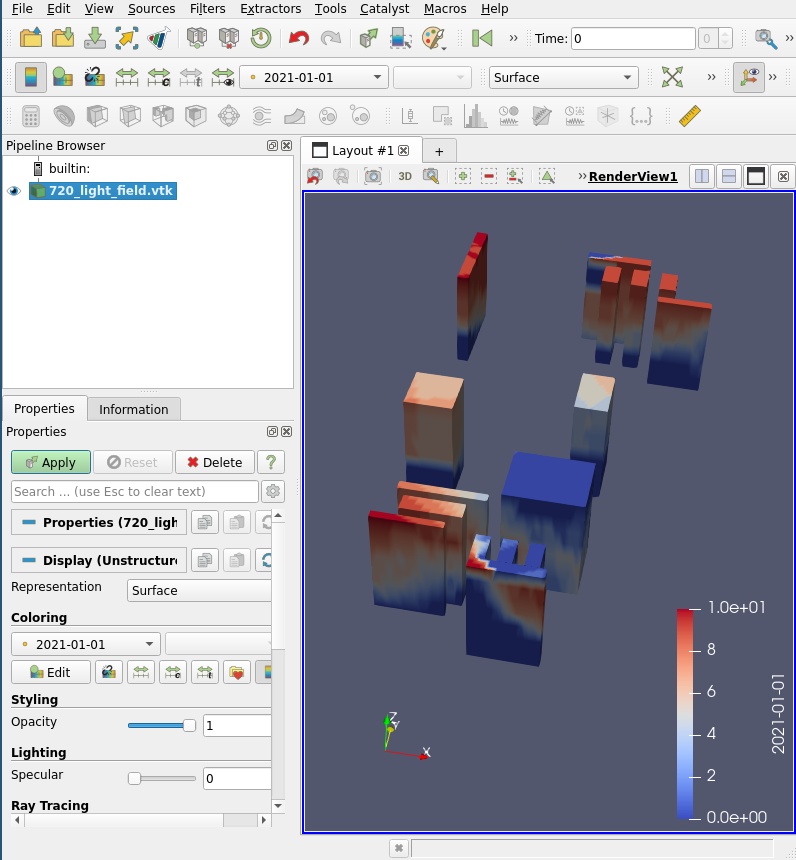 Paraview Screenshot
 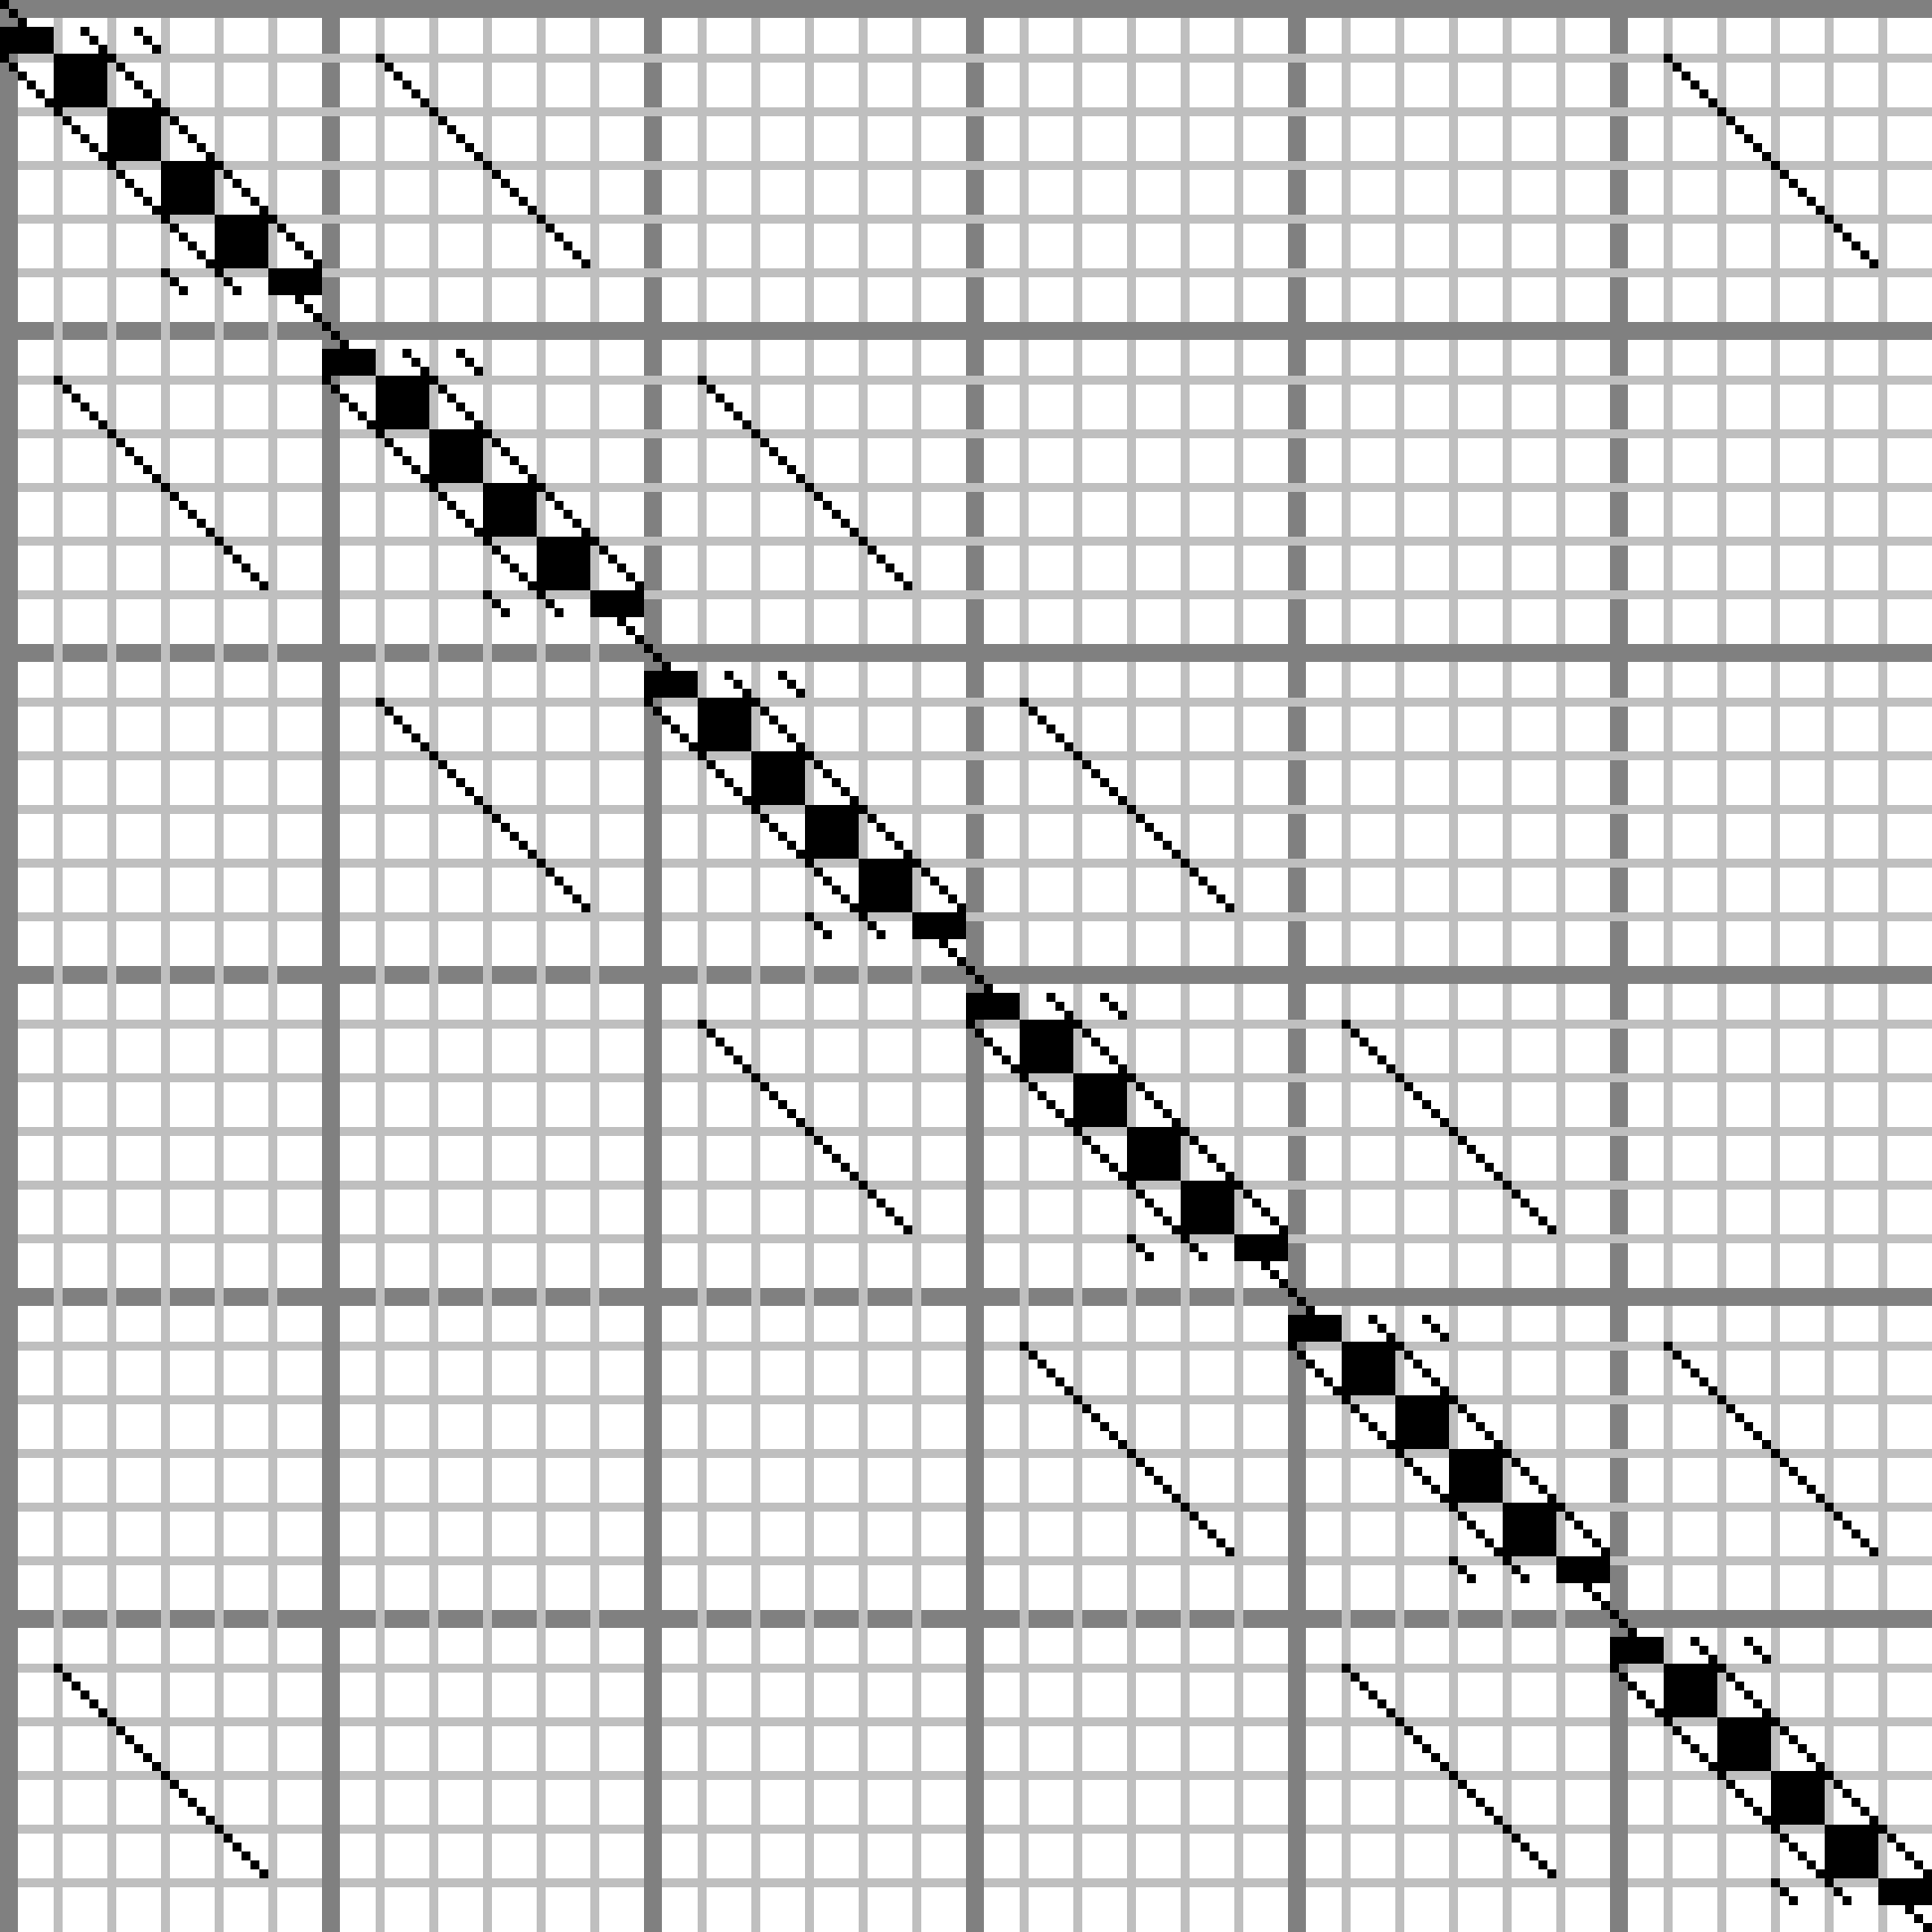 Int Hq 6x6x6 012
 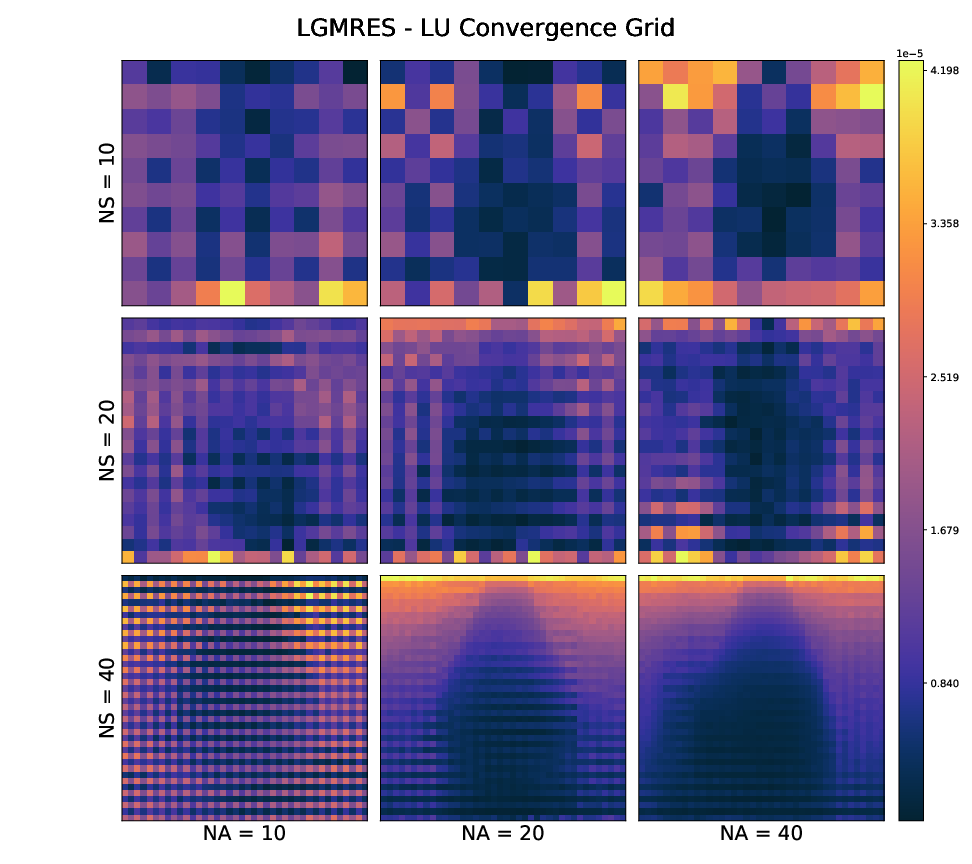 Diffgrid
 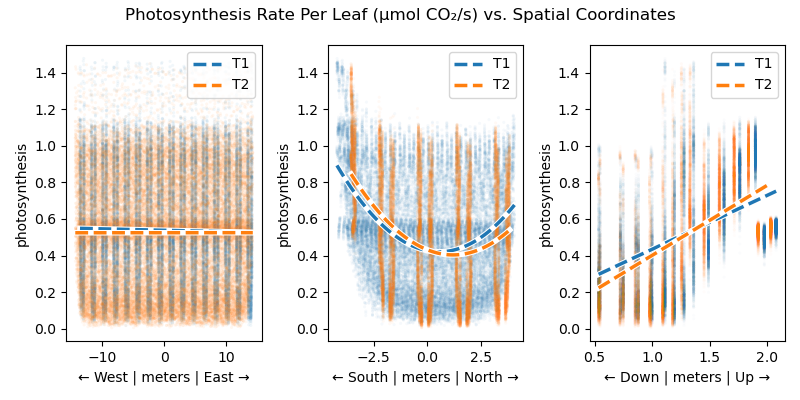 Leaf Photosynthesis Fit
 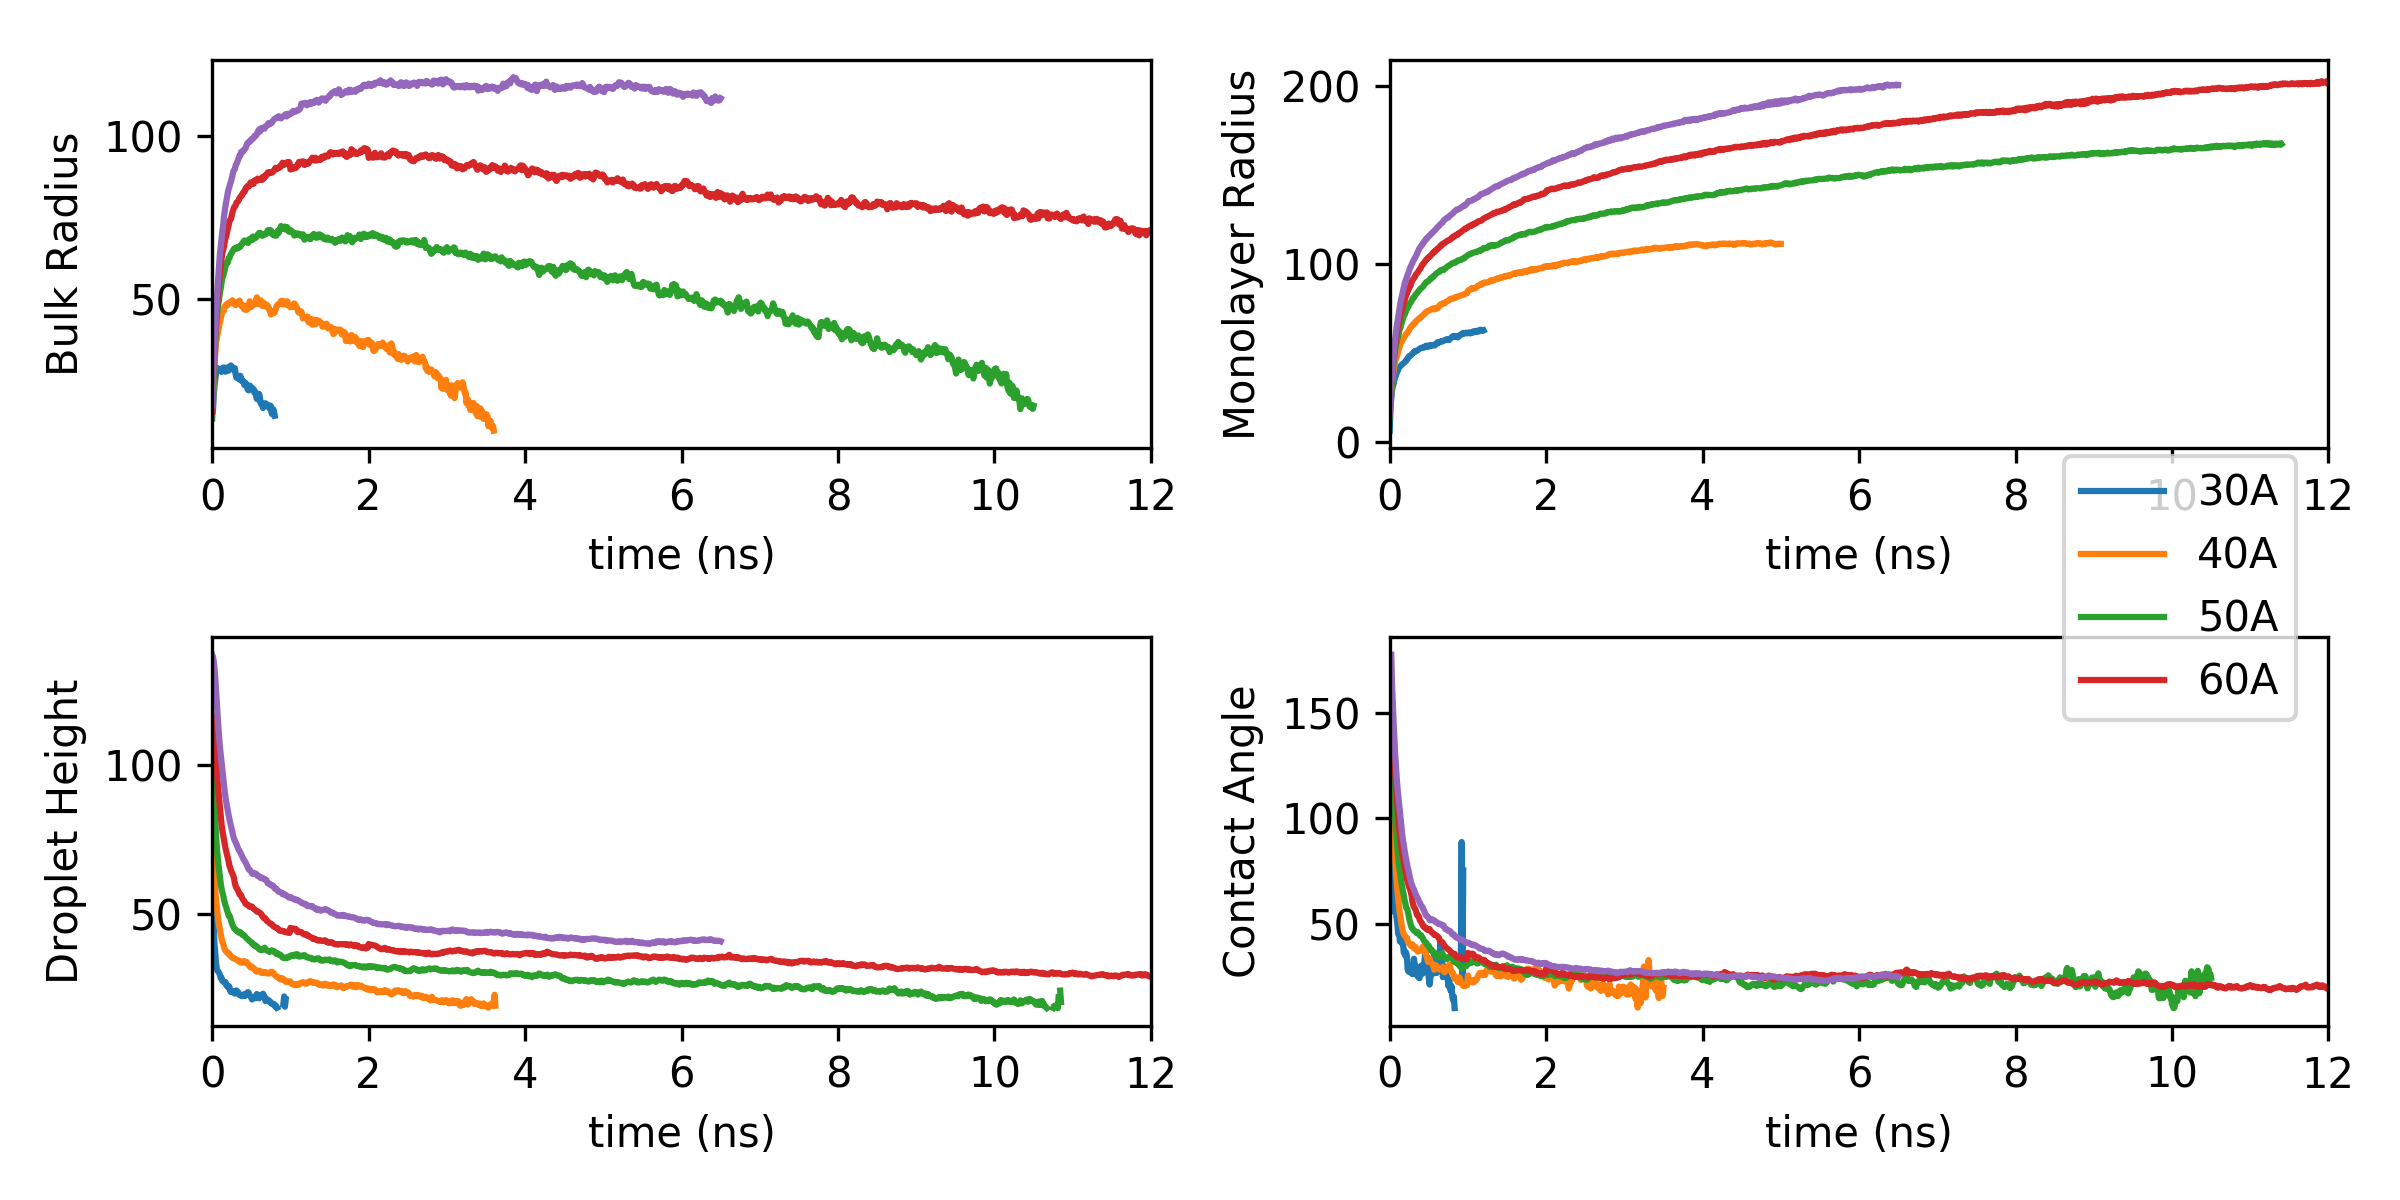 8
8 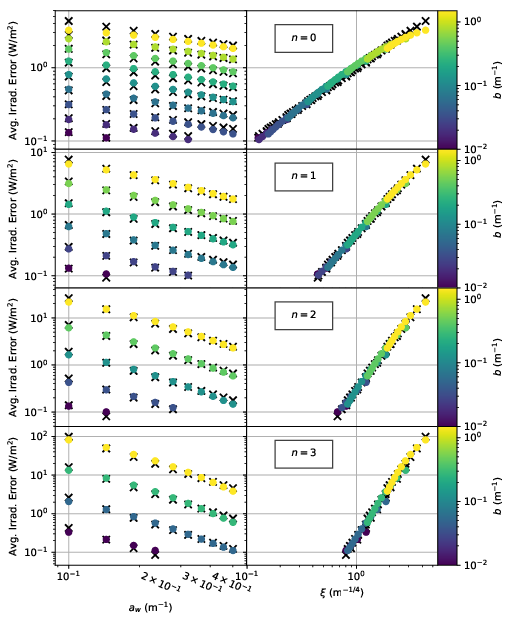 13
13 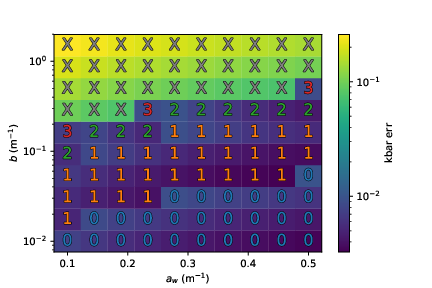 Min N Data Vs Ab Eps001
 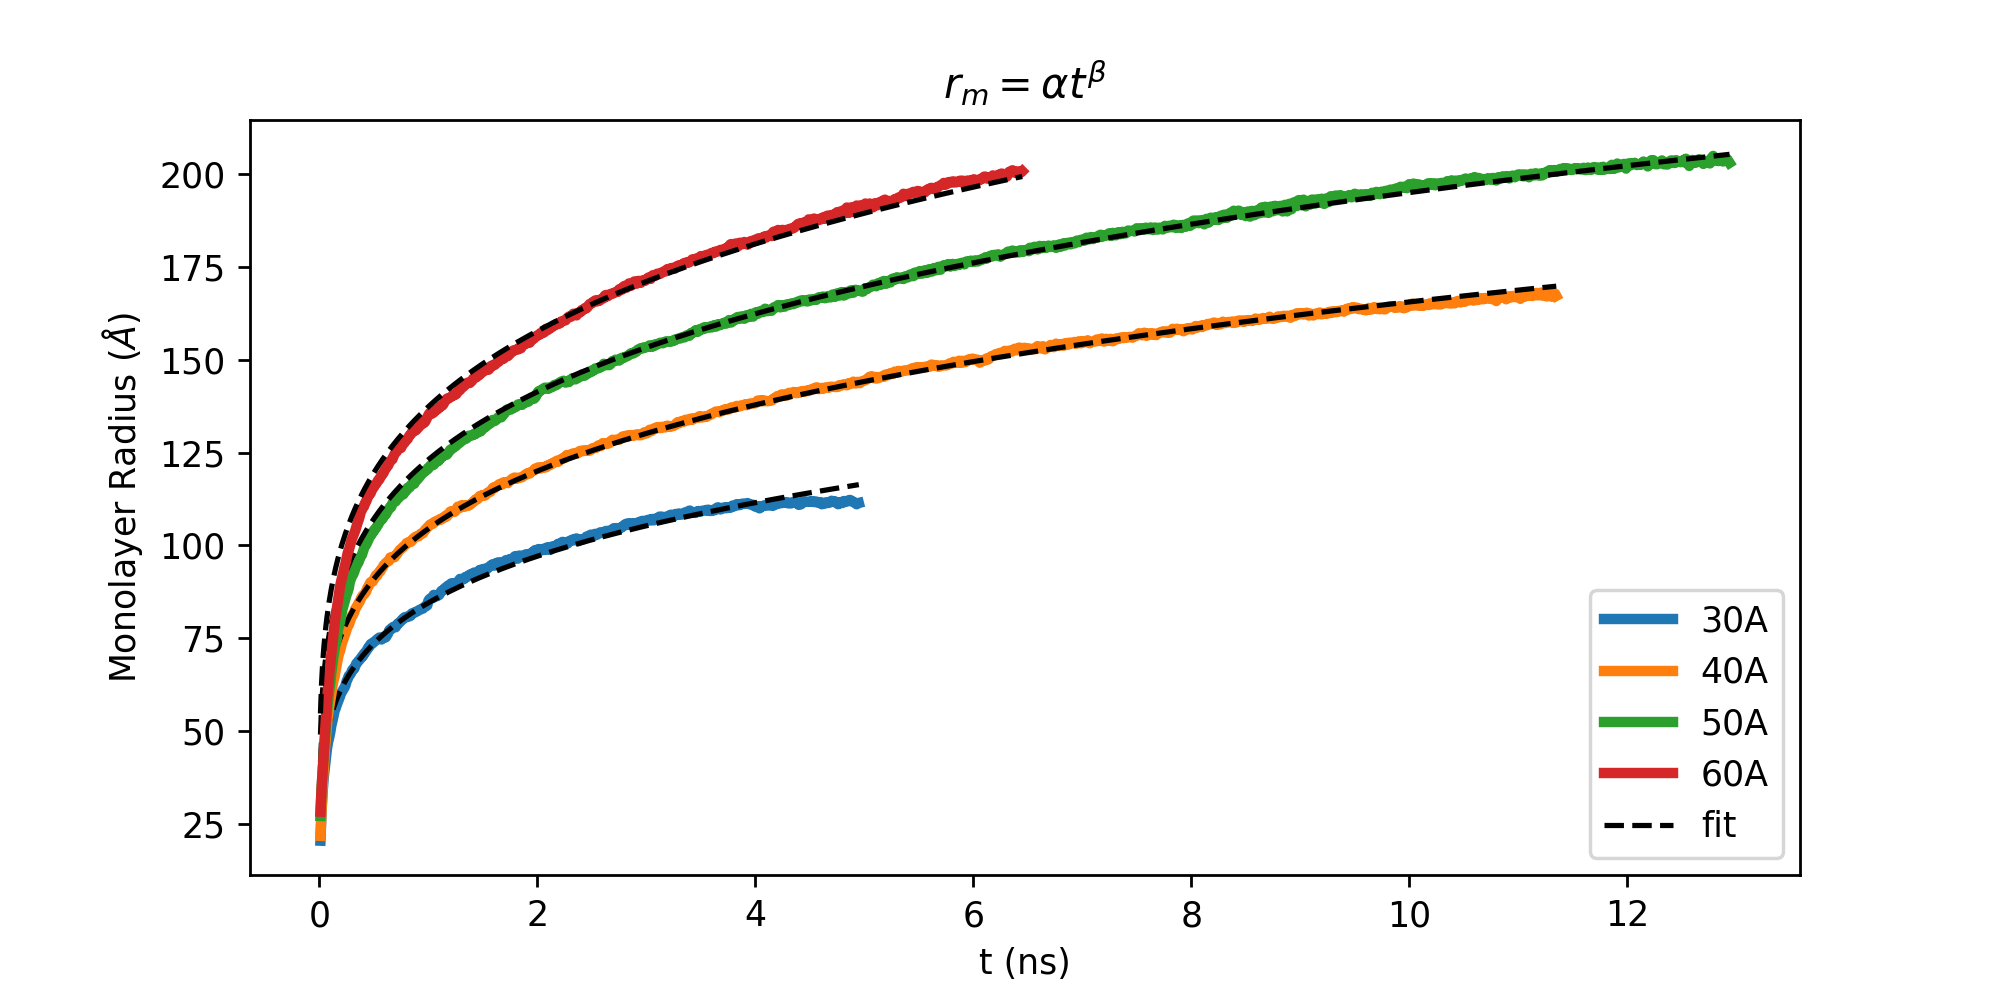 9
9 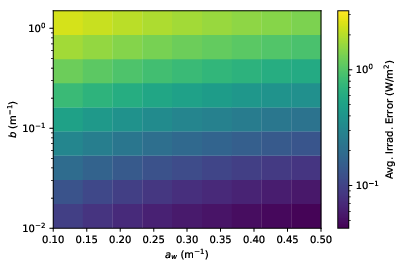 Asym Err Vs Ab
 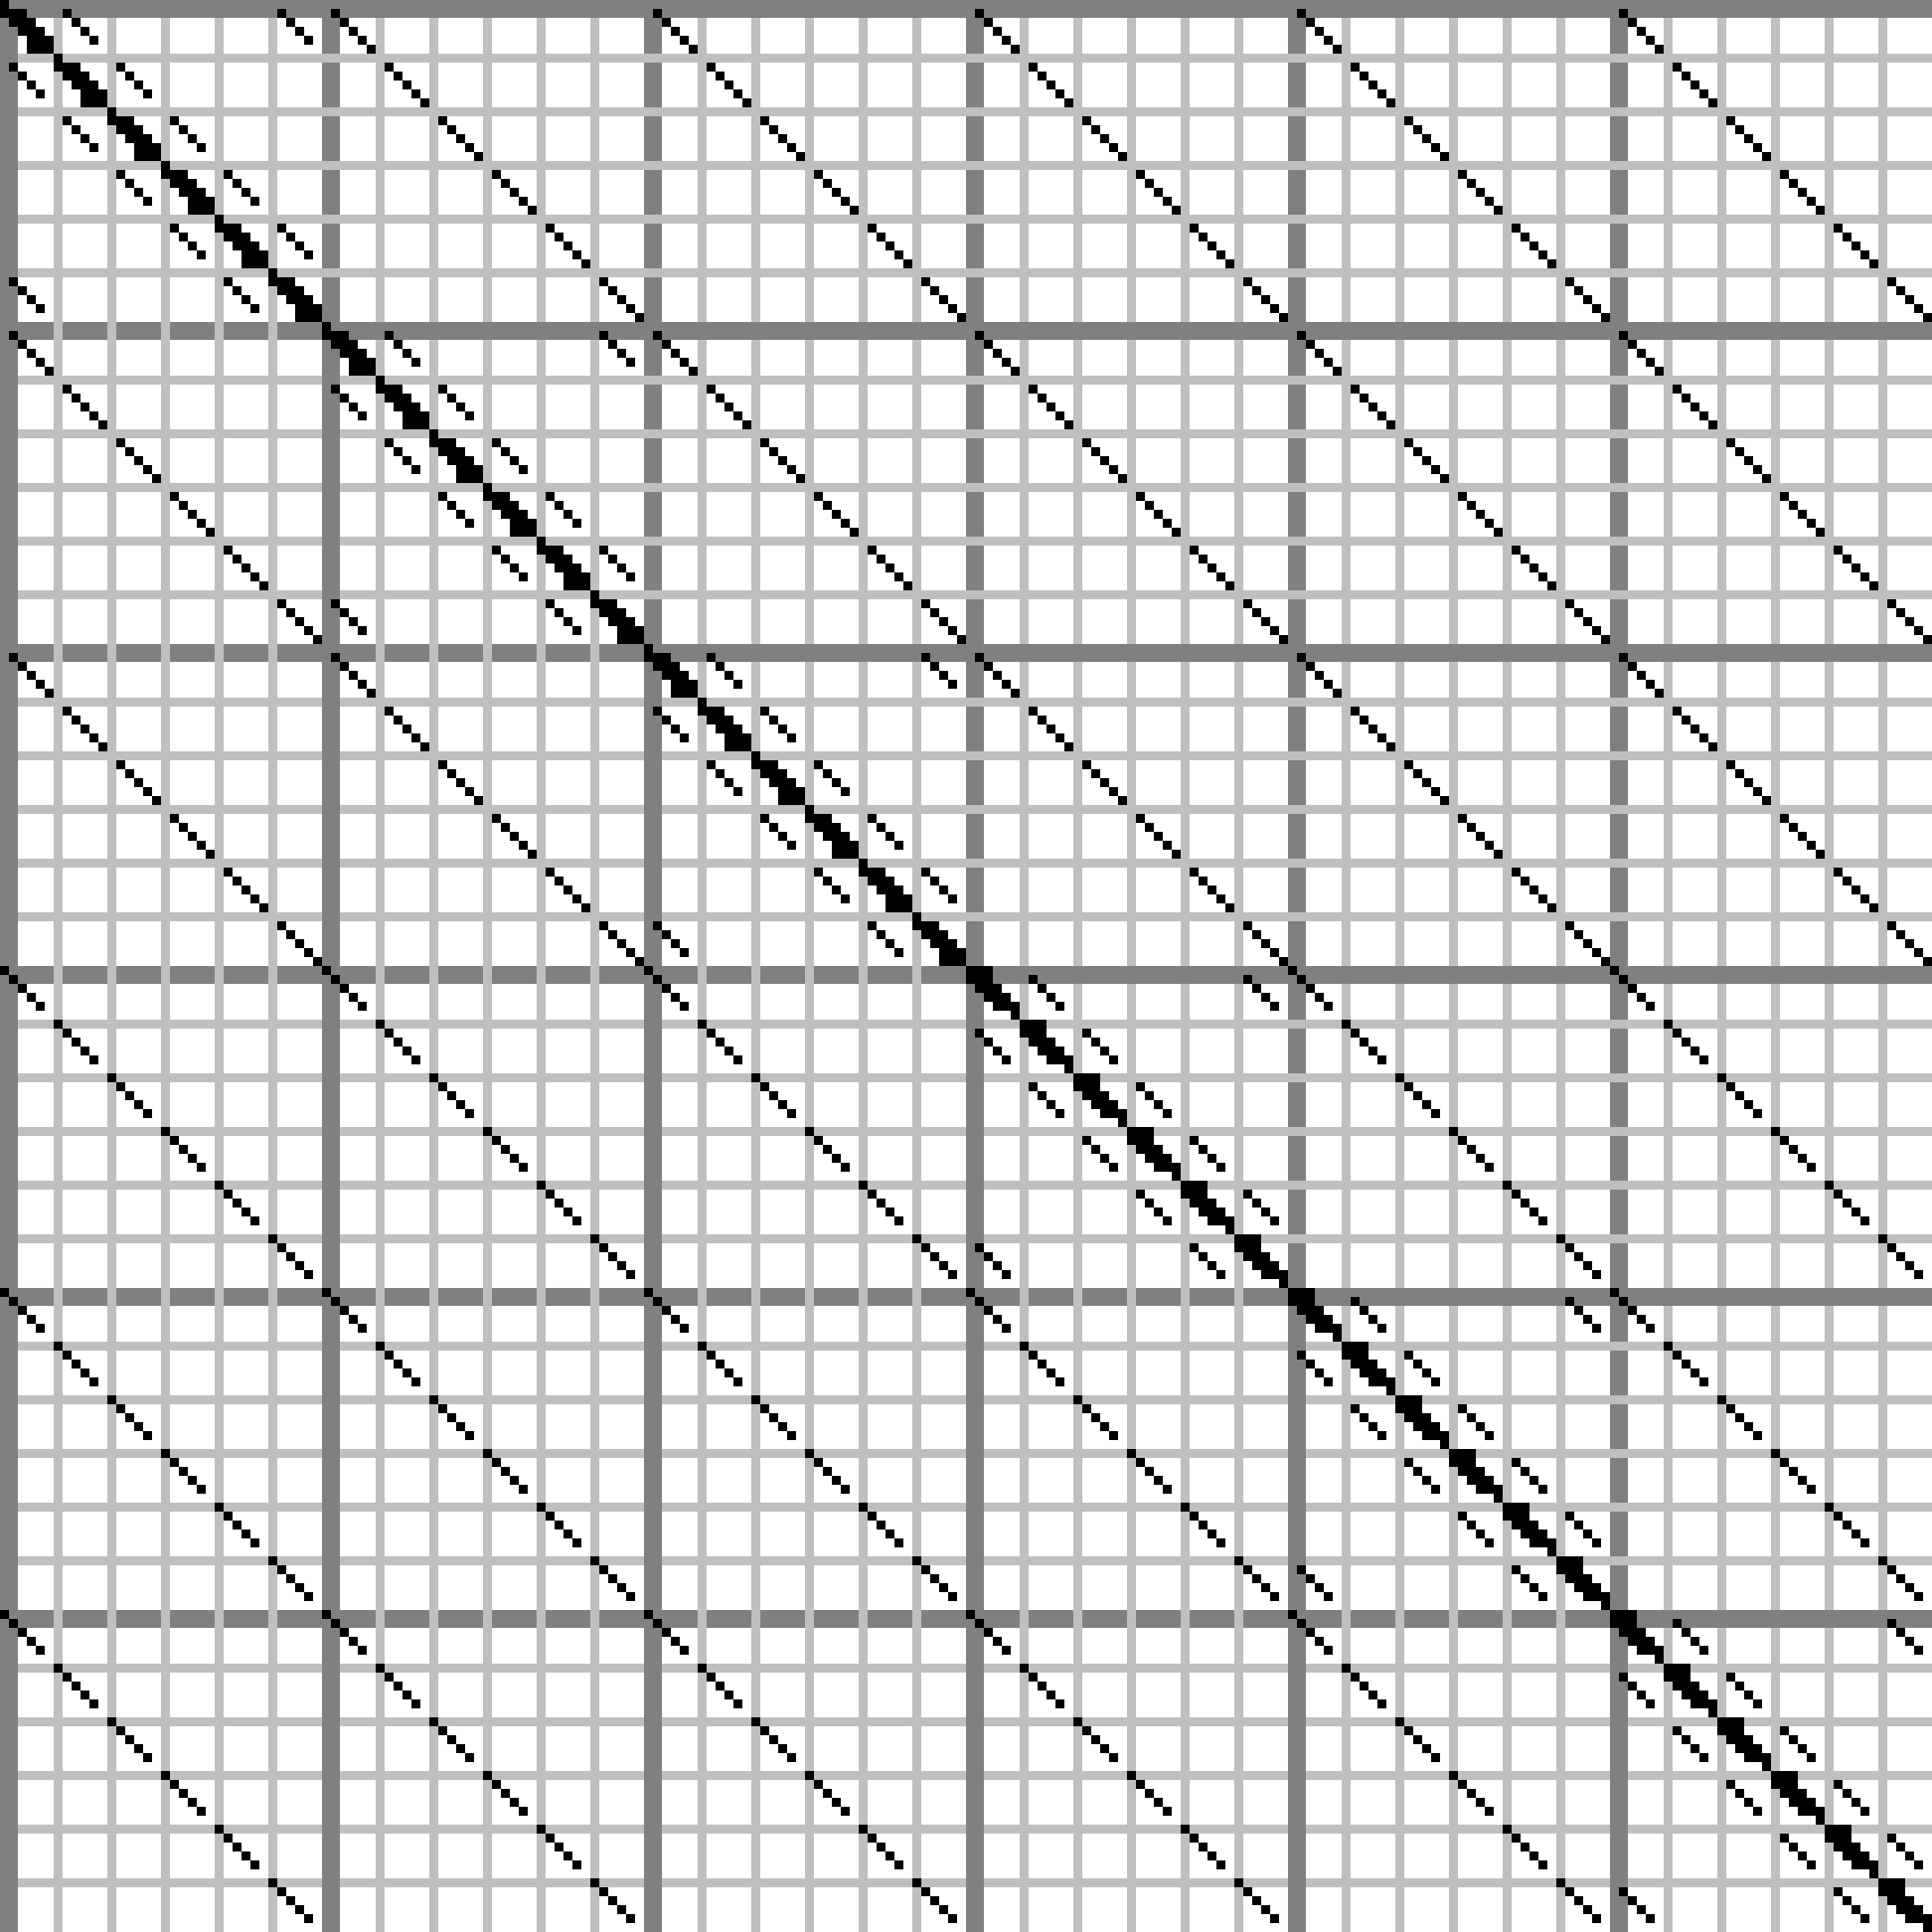 Int Hq 6x6x6 201
 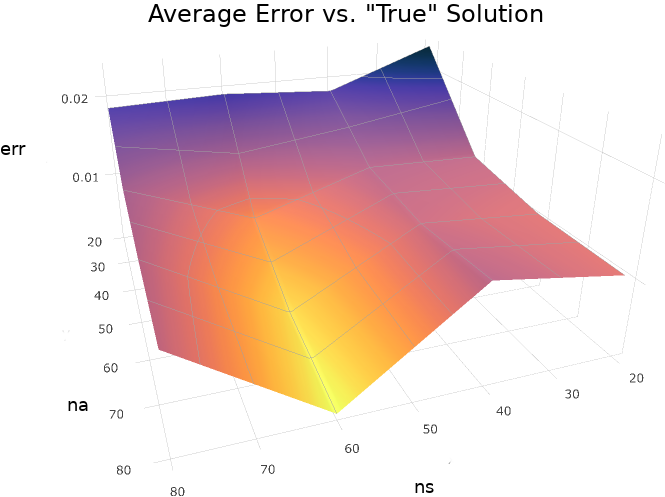 Avgerr 3d
 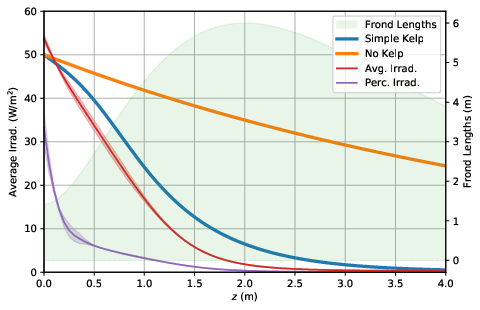 Compare Models Haoce11 Linear
 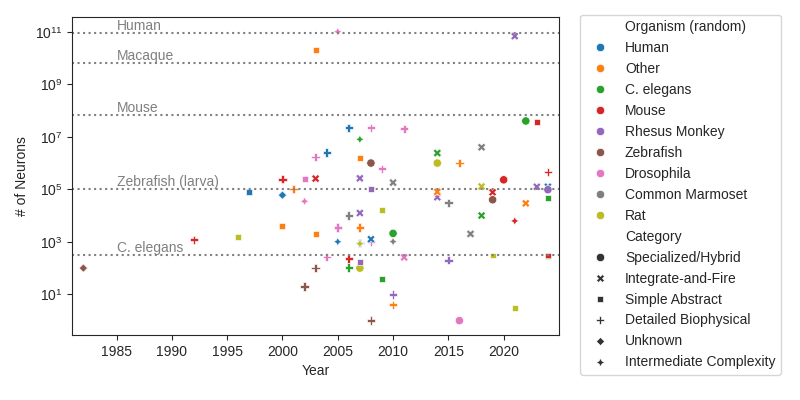 Num Neurons
 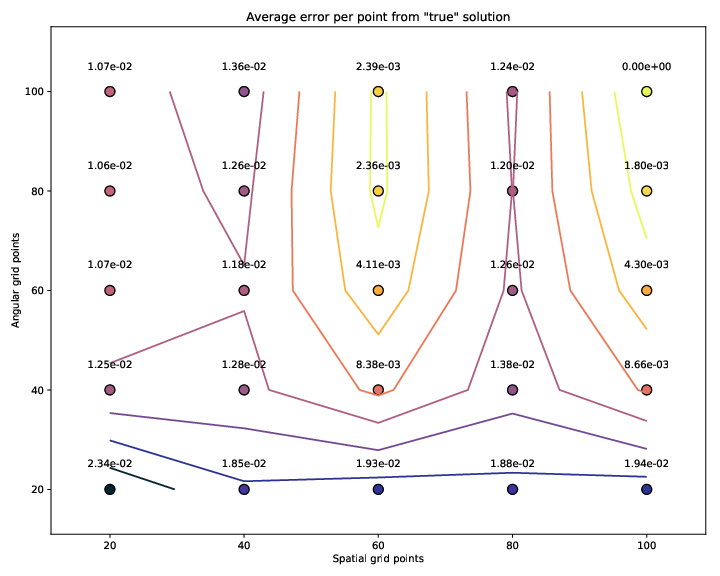 Avg Err
 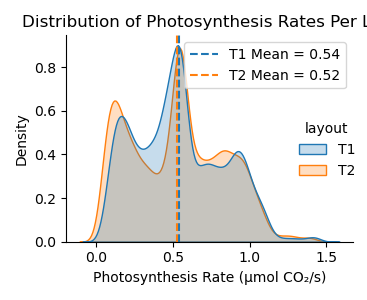 Leaf Photosynthesis Distributions
 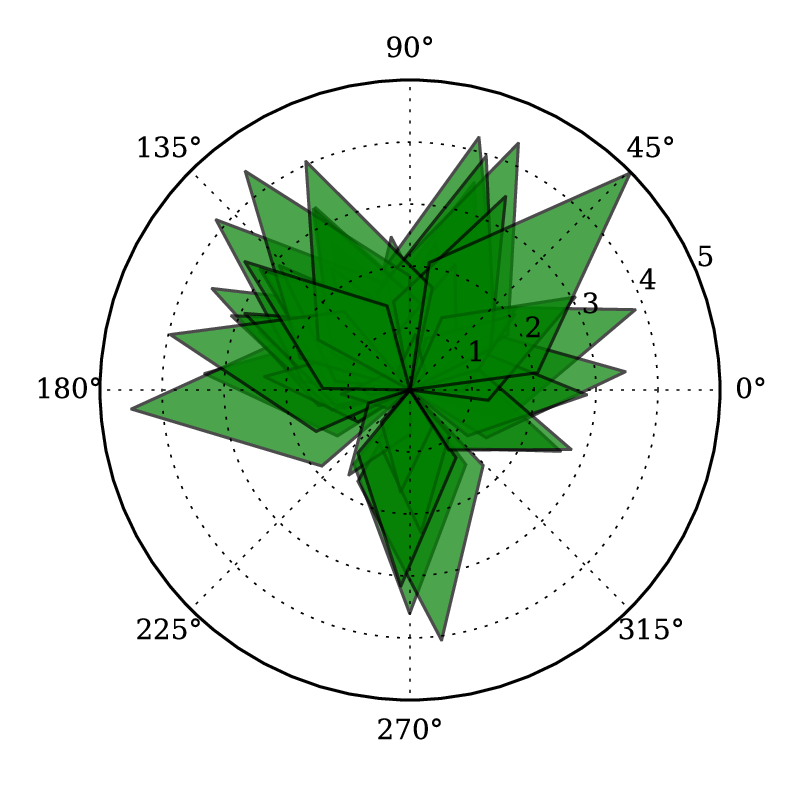 Kelp Sample
 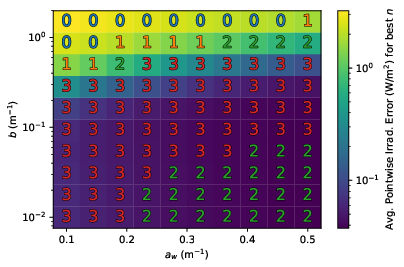 Best N Data Vs Ab
  Int Hq 6x6x6 120
 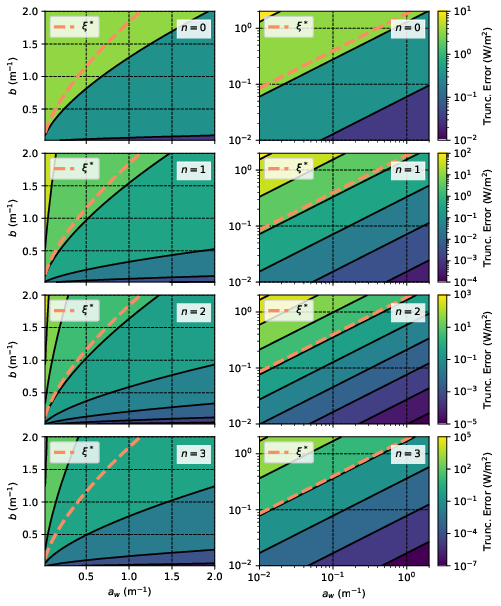 Asym Err Model Vs Ab All N
 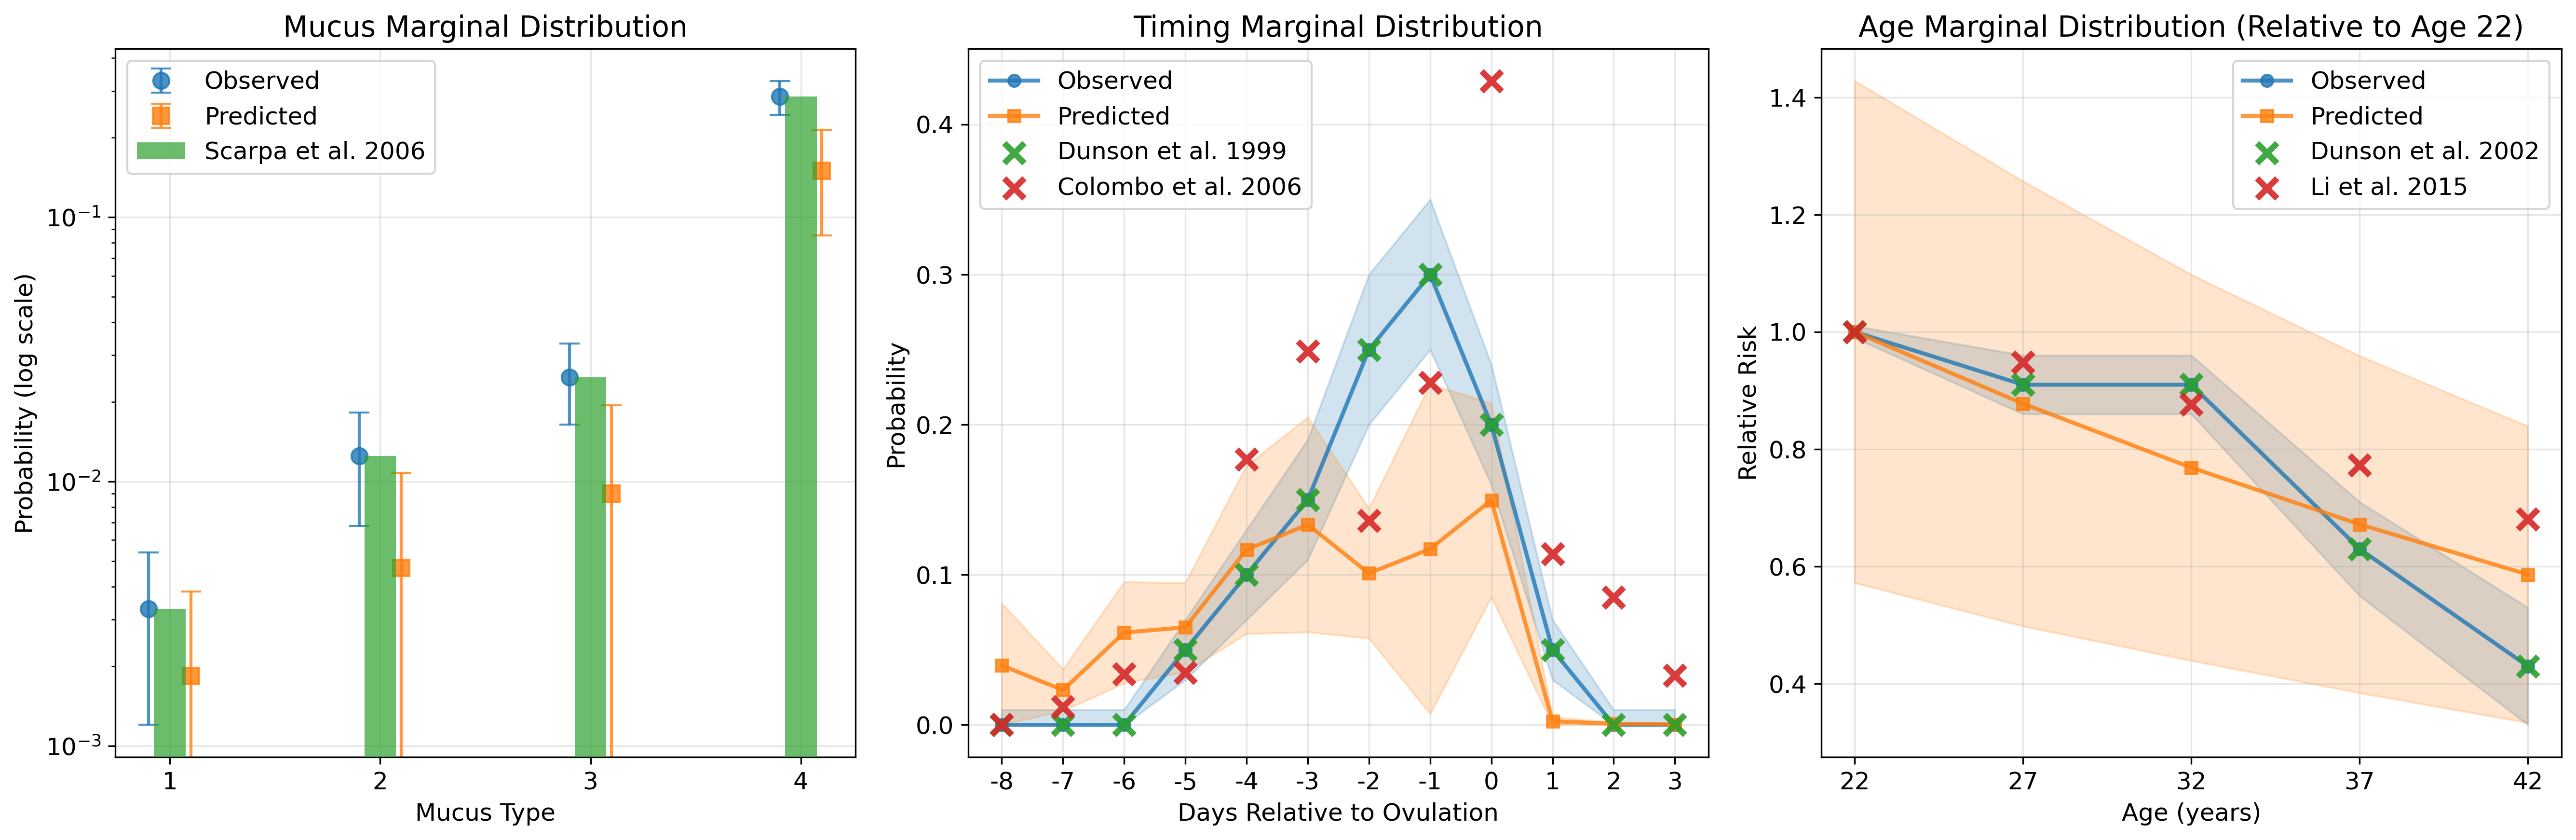 Marginal Distribution Comparisons
 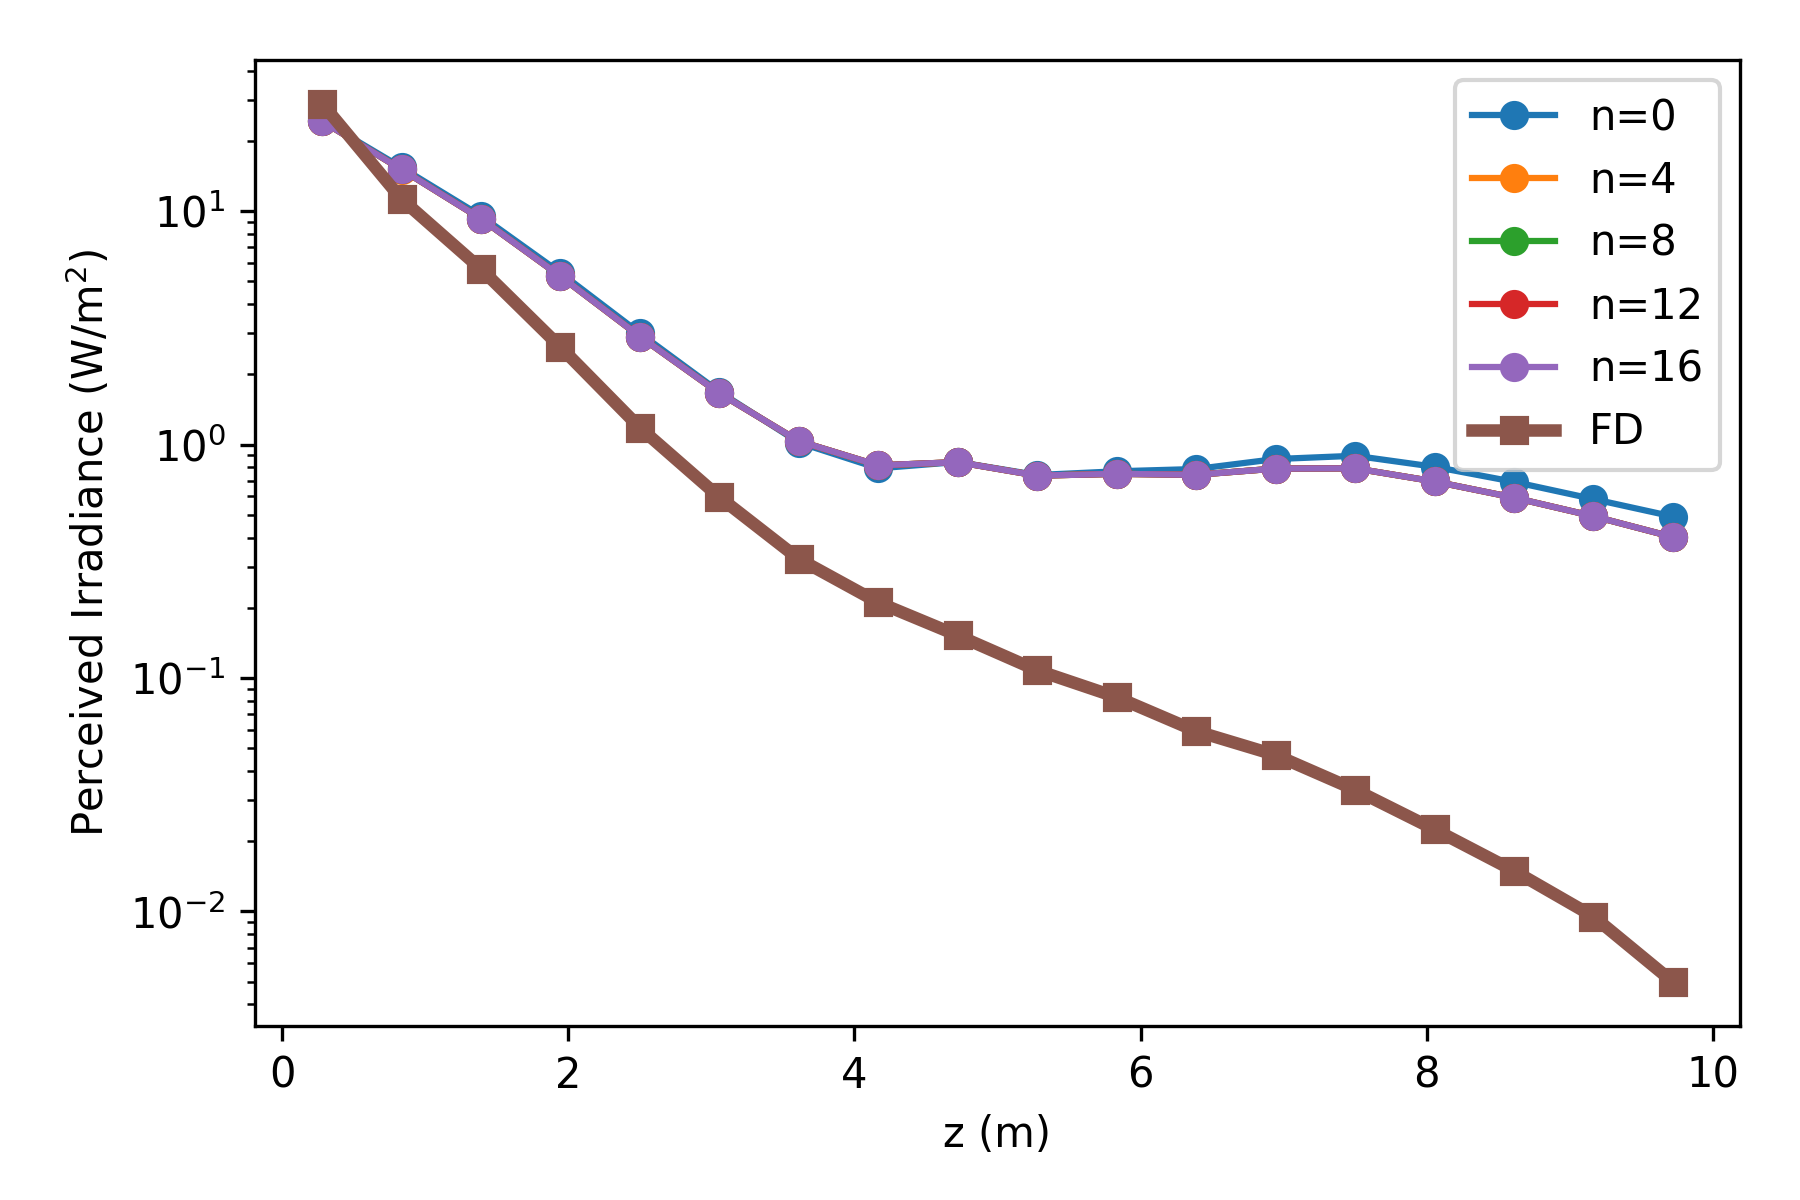 Asym Conv Irrad Aut8
 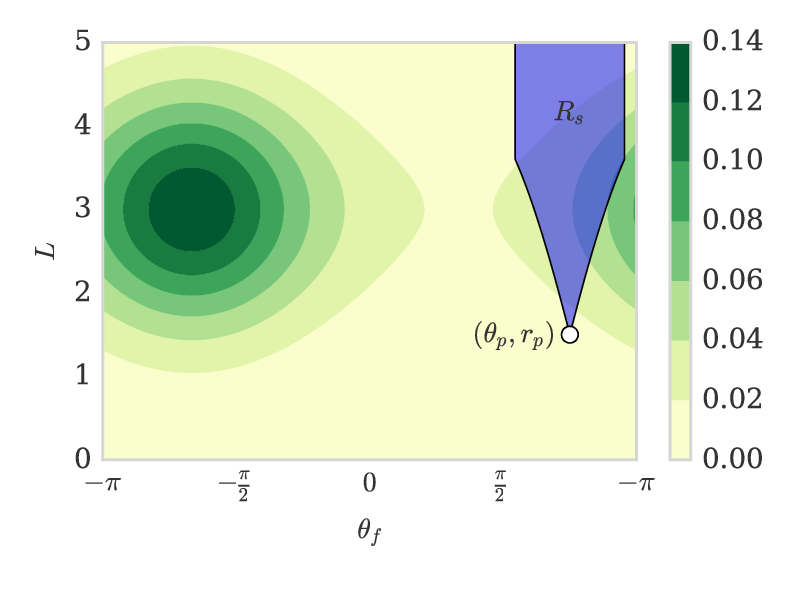 Cart Shade
 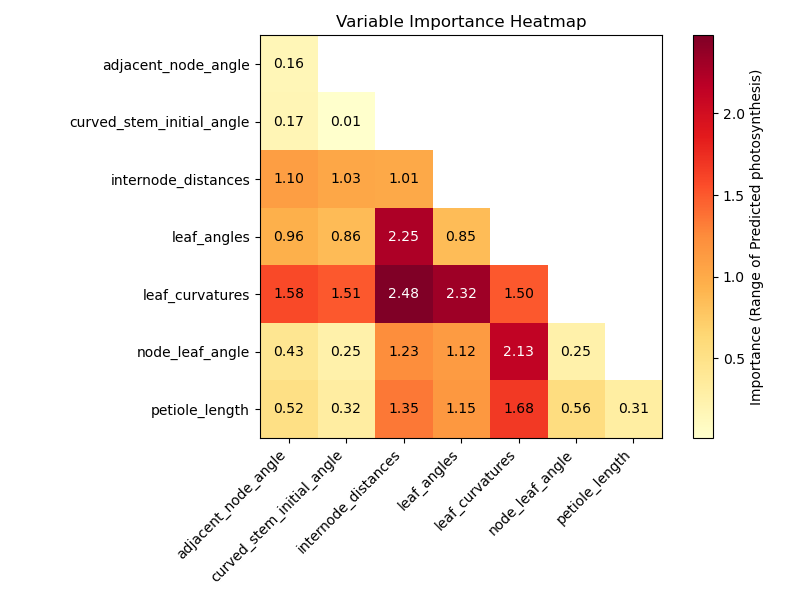 Plant Fixed Leaf Size Heatmap
  Int Small 6x6x6 120
 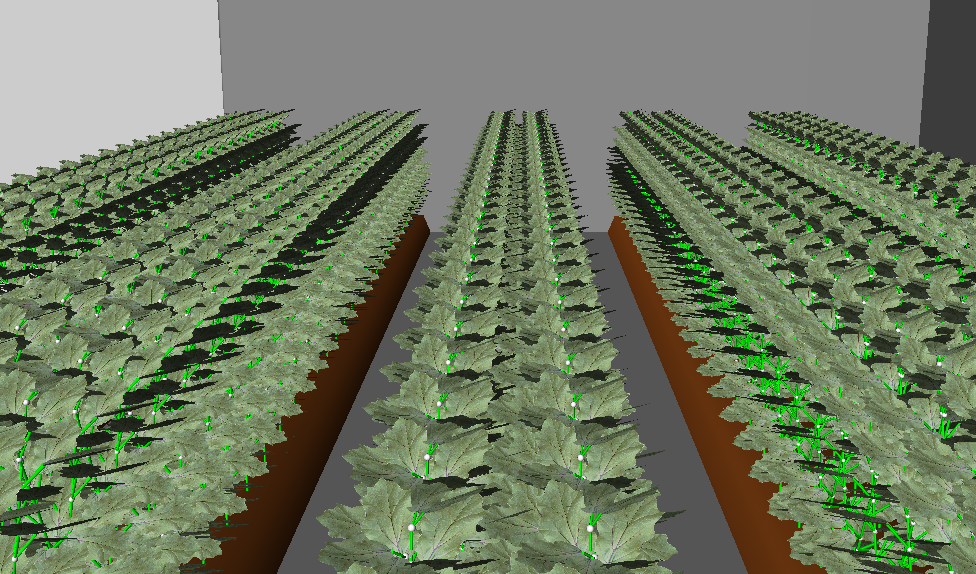 2025 04 29 031839 976x574 Scrot
 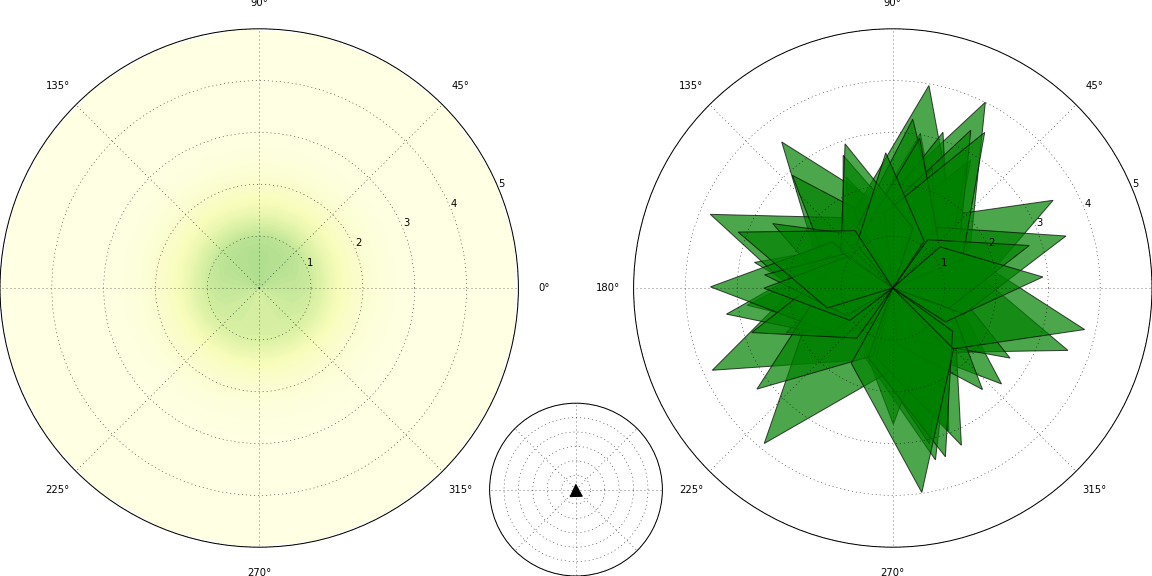 151
151 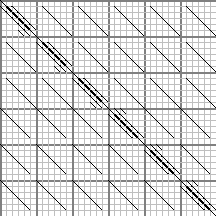 Int Small 6x6x6 210
 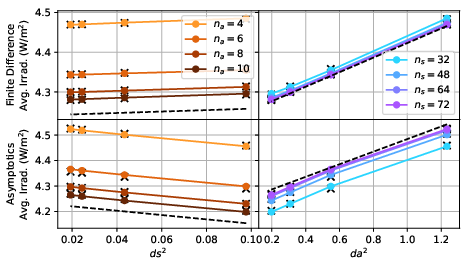 11
11 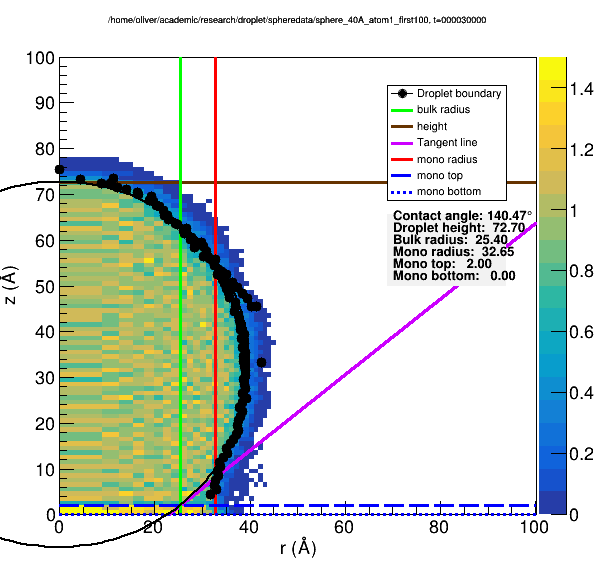 Droplet
 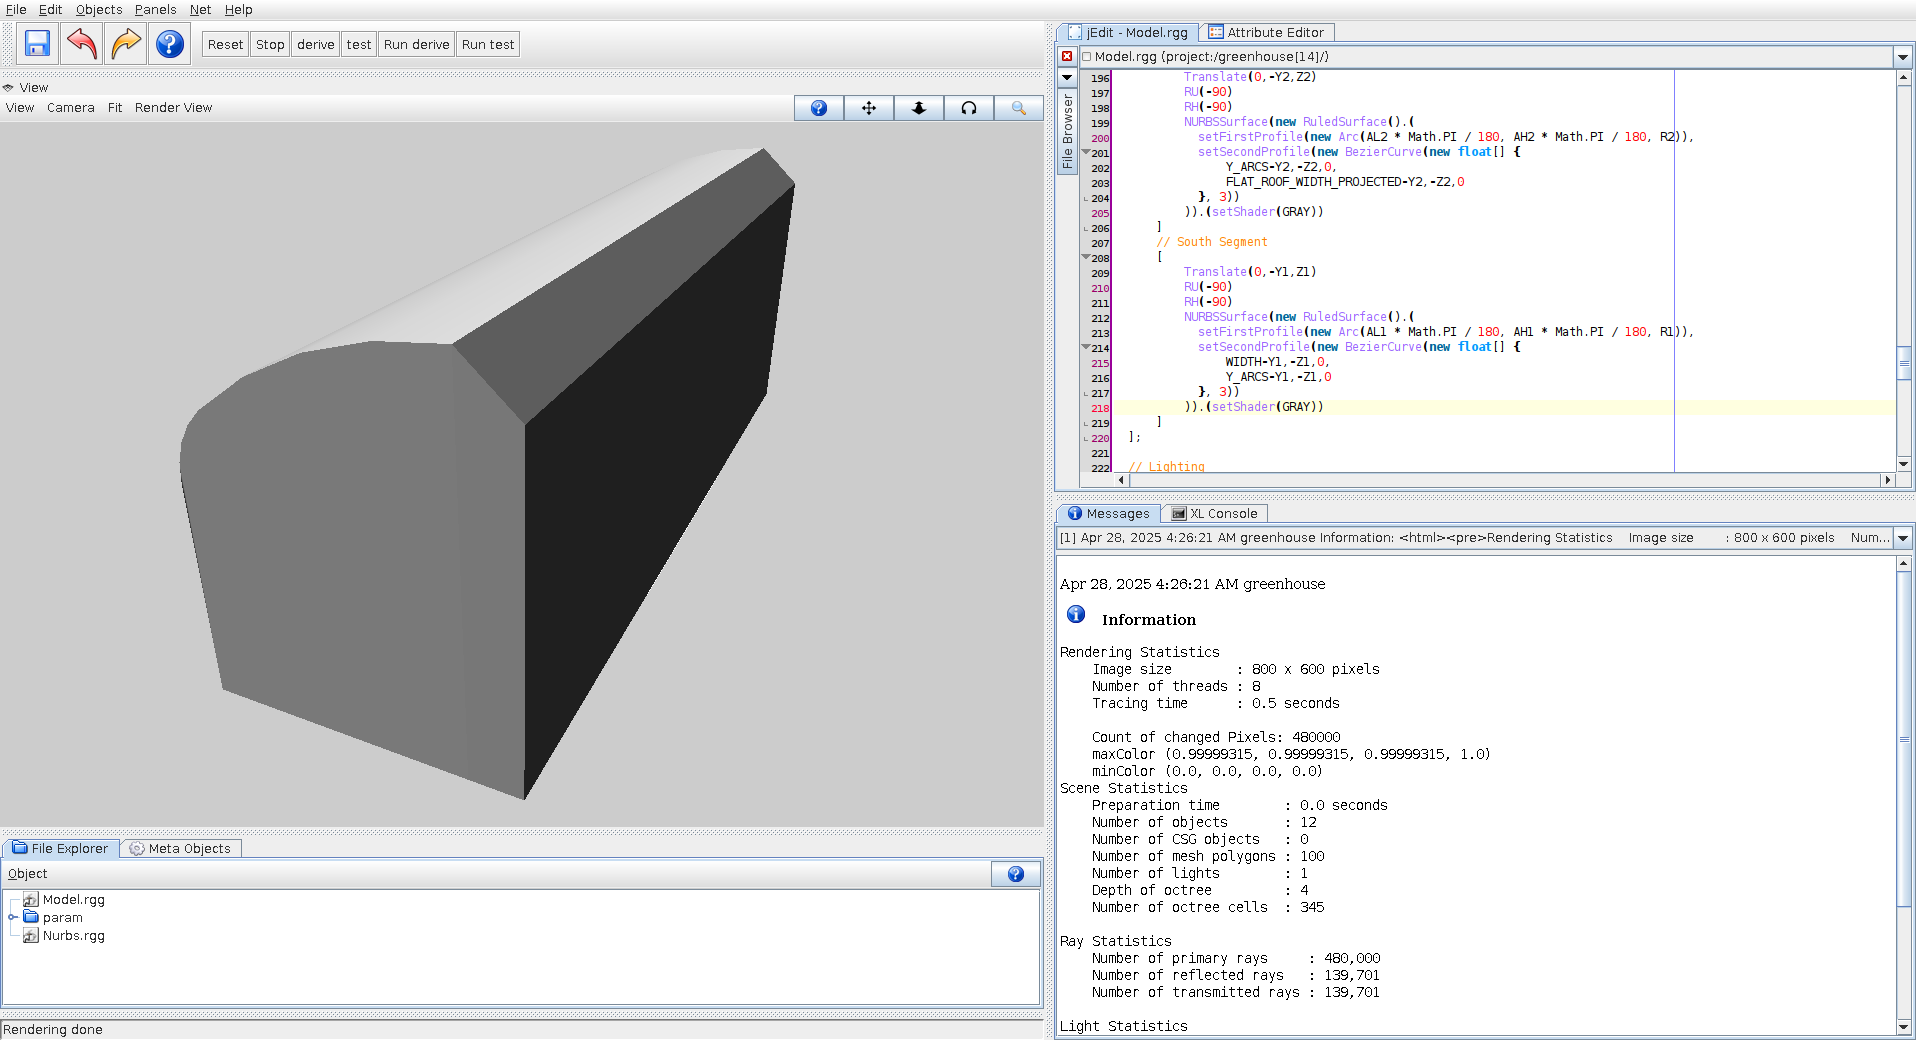 Greenhouse Opengl
 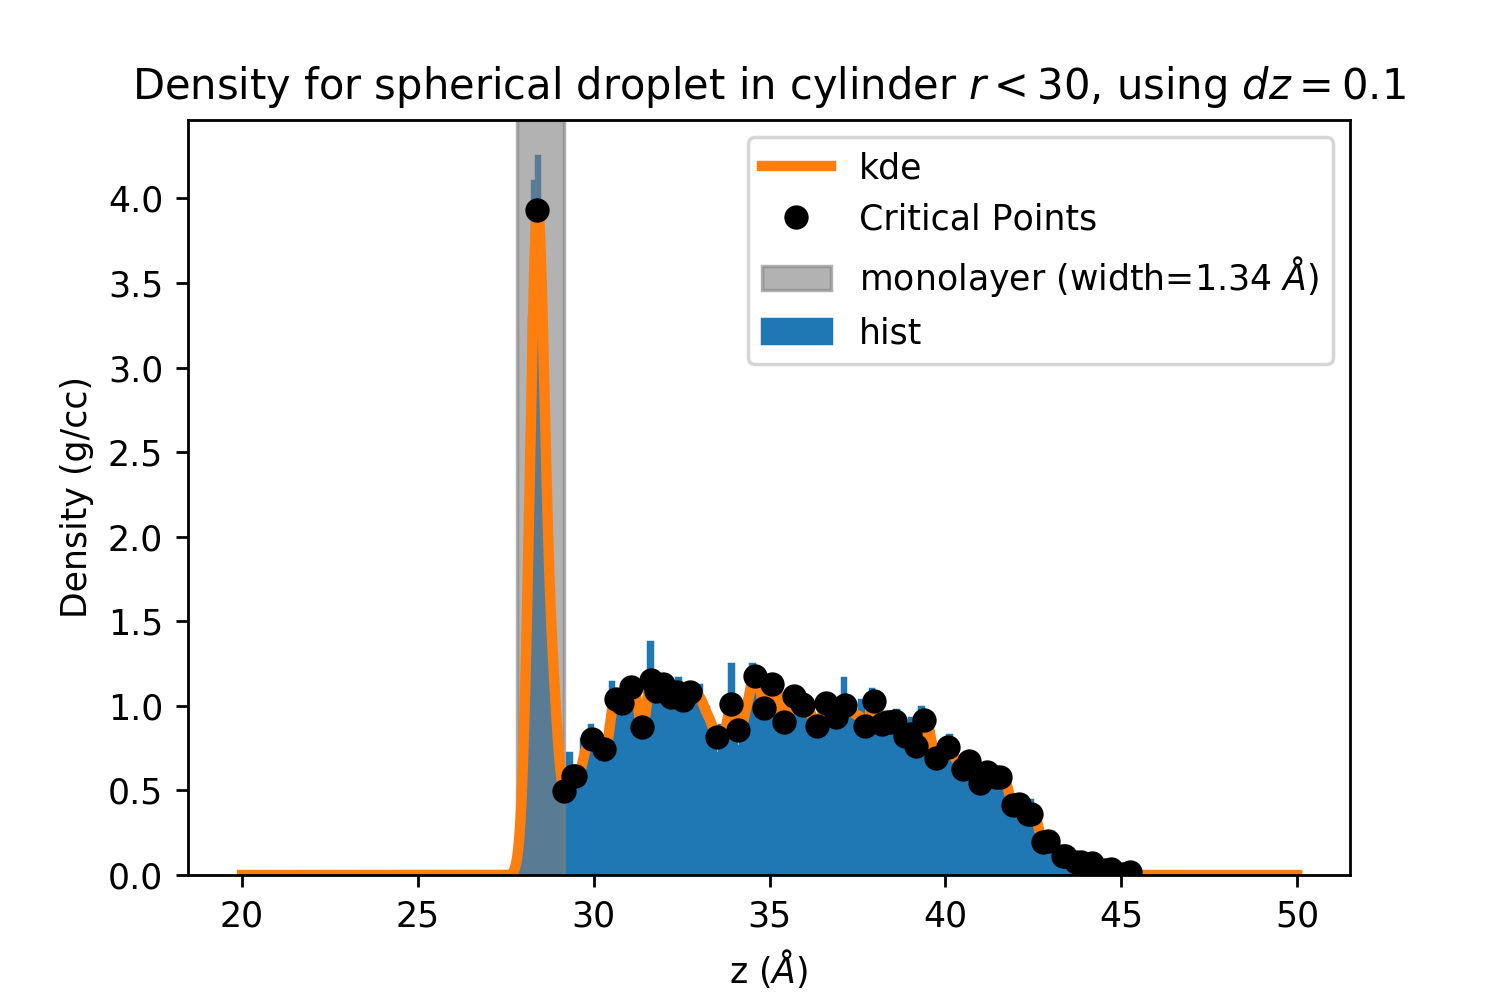 7
7  10
10 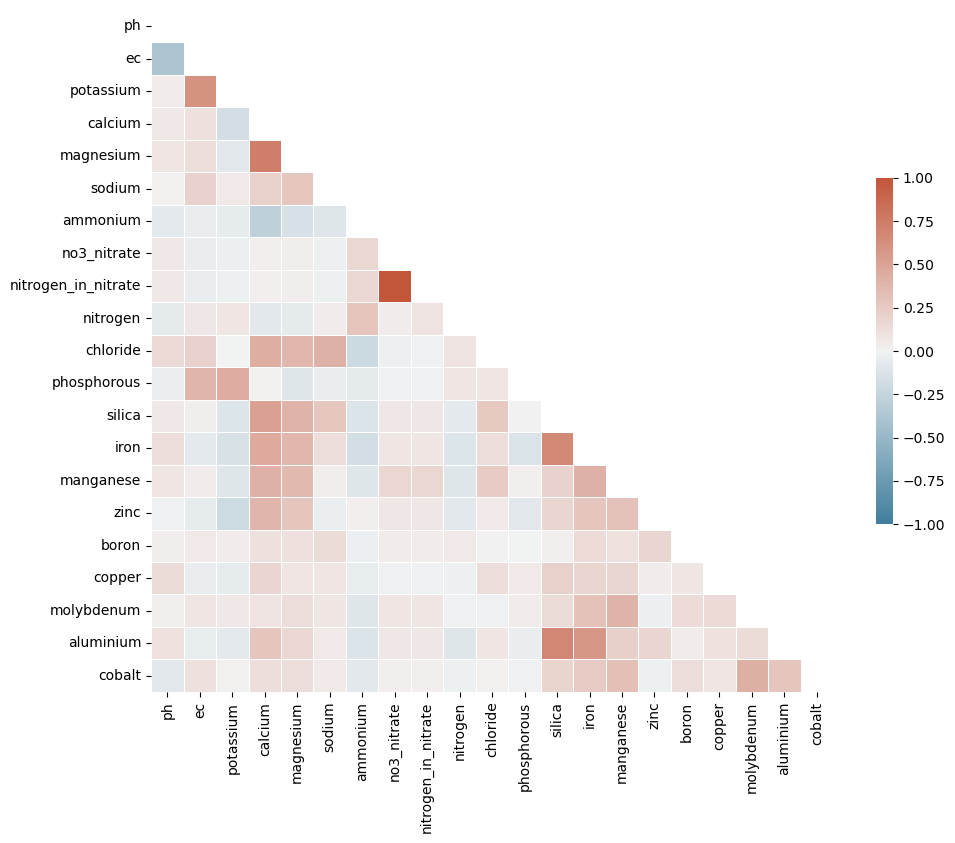 Corrplot
 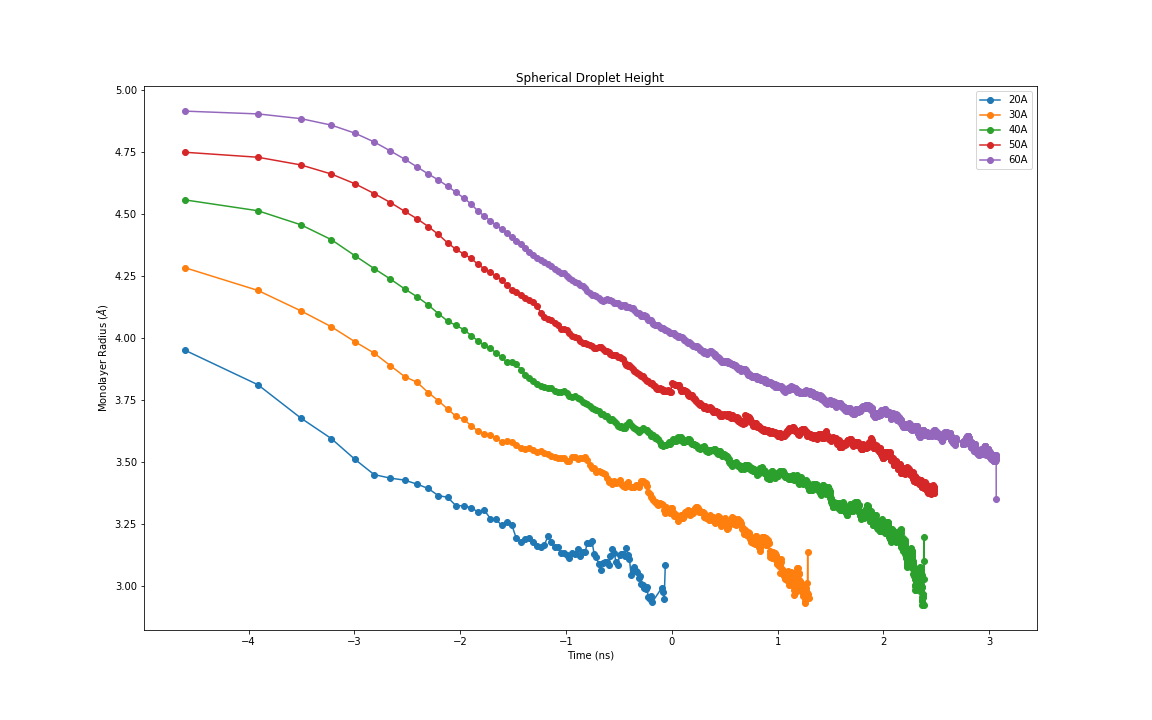 Br Latest
 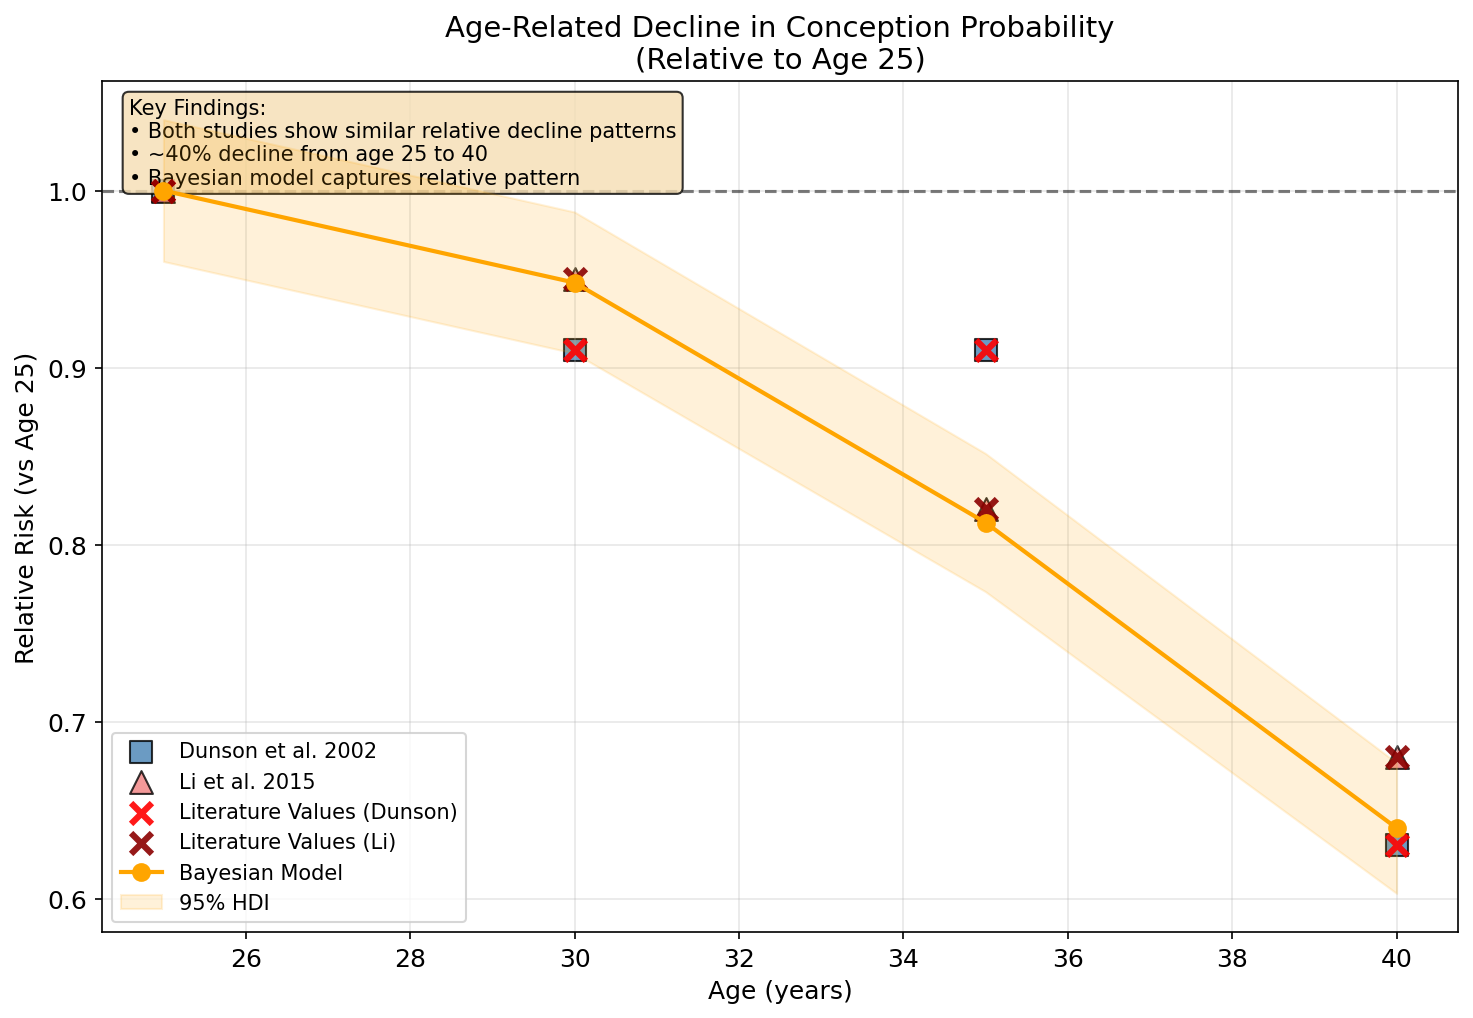 Age Effects Bayesian Validation
 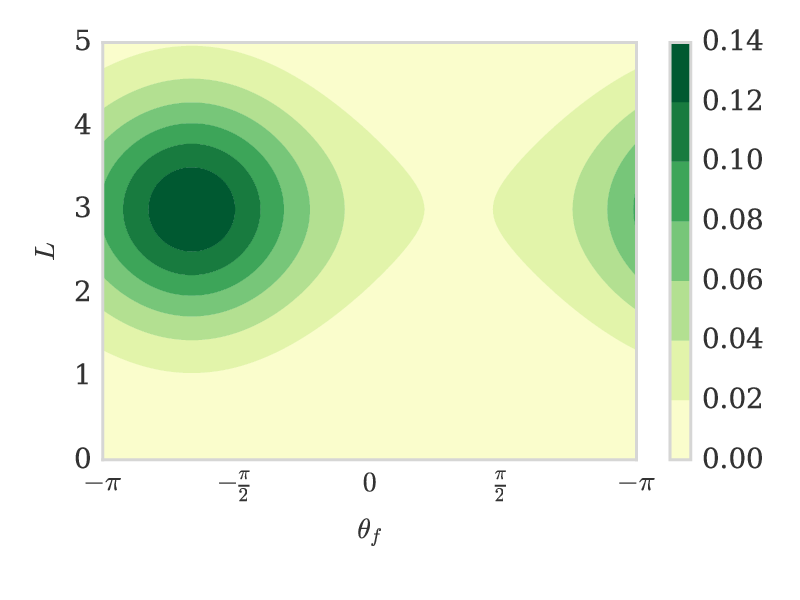 Prob 2d
 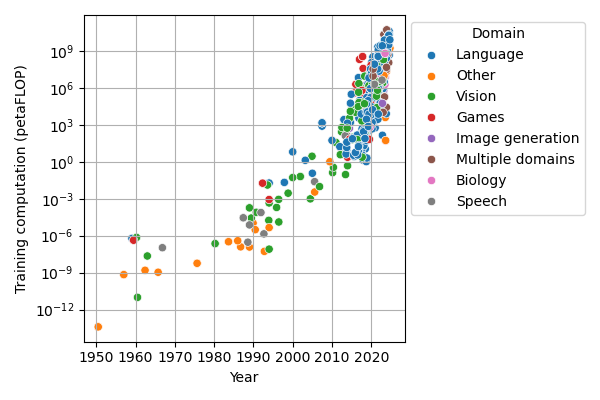 Compute
 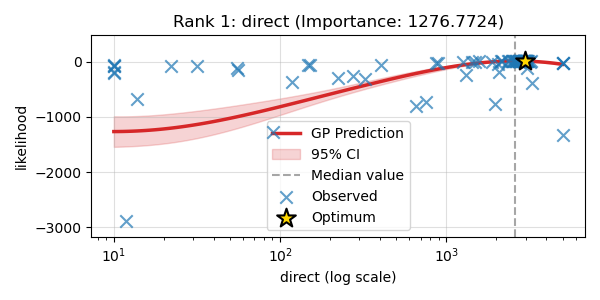 Lighting Calibration Univariate 1
 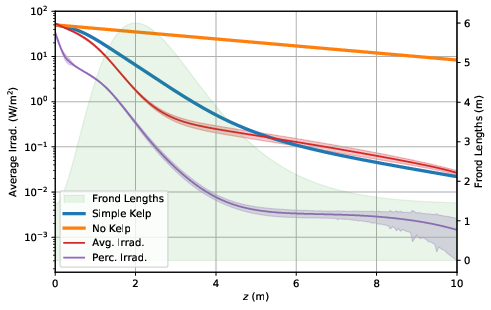 Compare Models Haoce11
 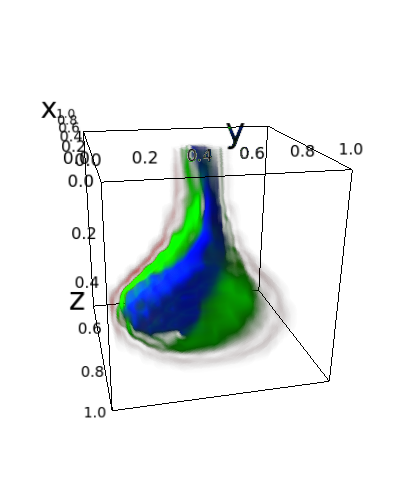 Bottom Heavy Kelp
 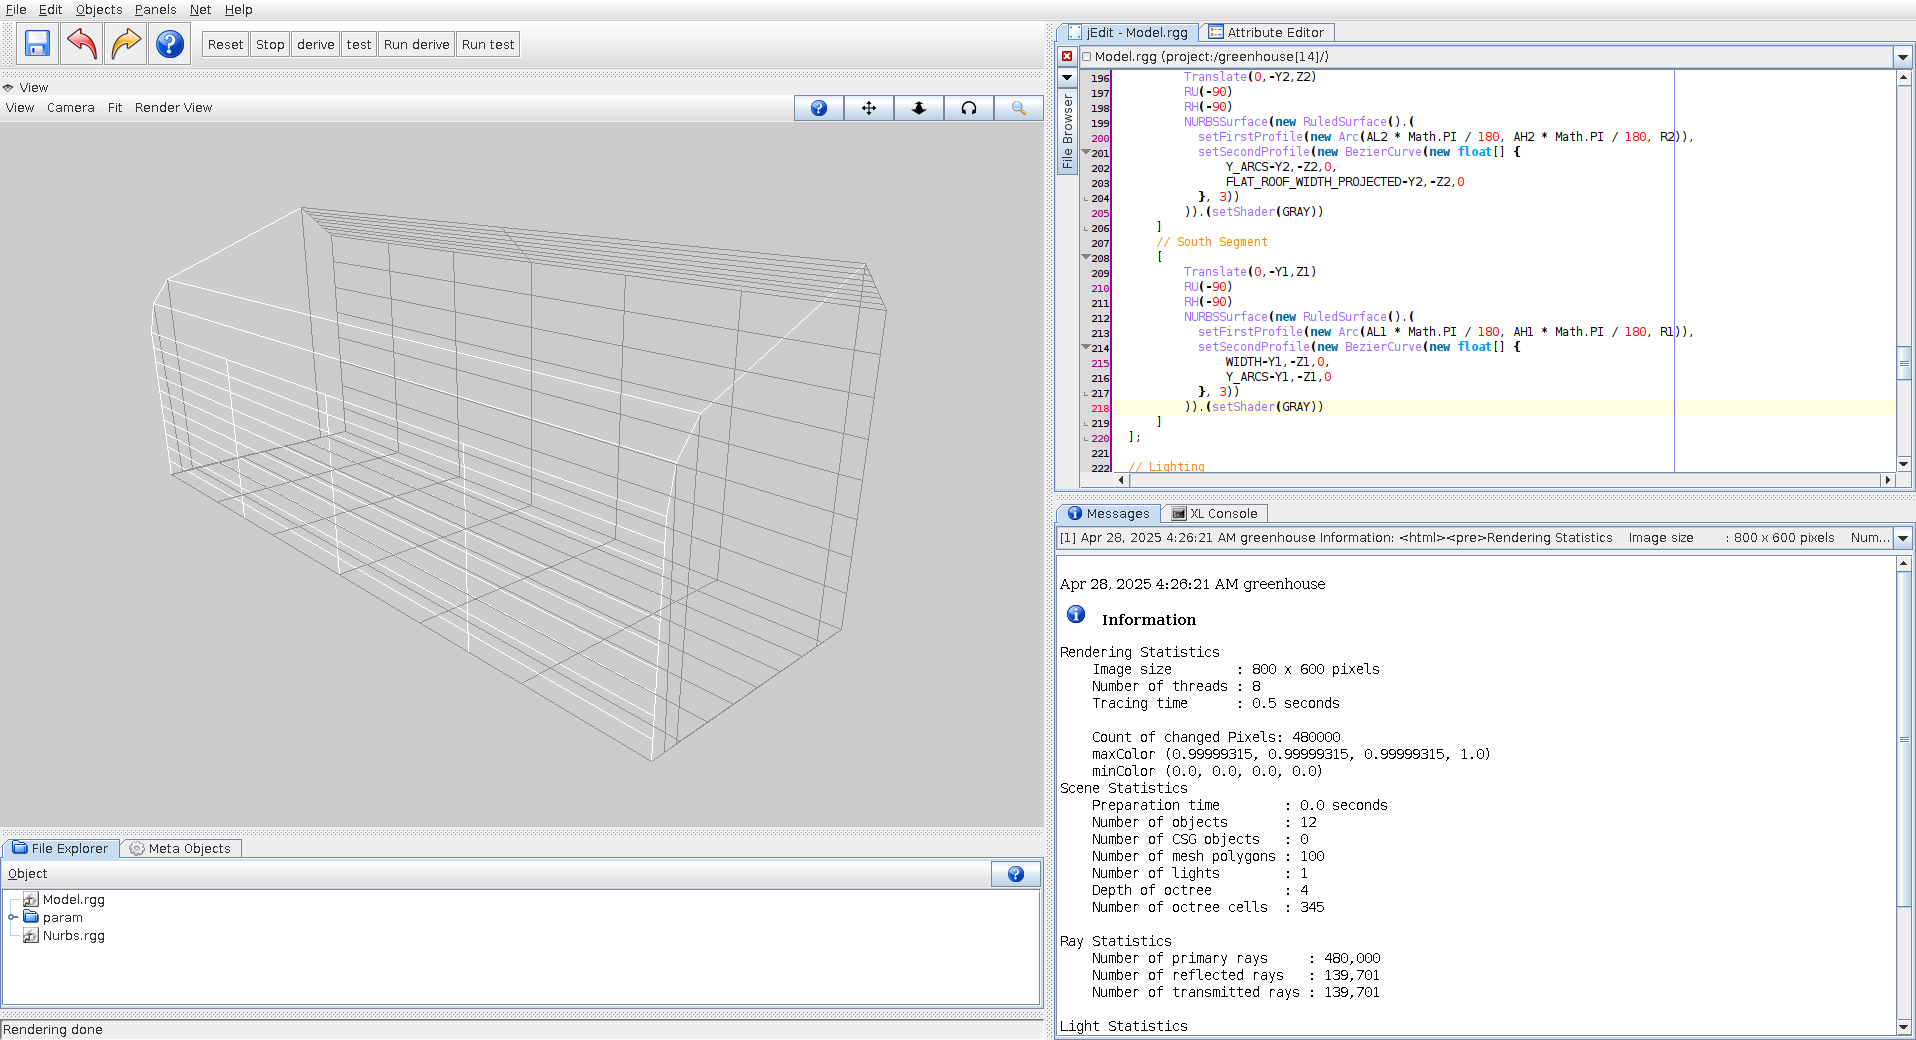 Greenhouse Wireframe